
|
시장보고서
상품코드
2120687
운송 컨테이너 : 시장 점유율 분석, 업계 동향 및 통계, 성장 예측(2026-2031년)Shipping Containers - Market Share Analysis, Industry Trends & Statistics, Growth Forecasts (2026 - 2031) |
||||||
 Mordor Intelligence
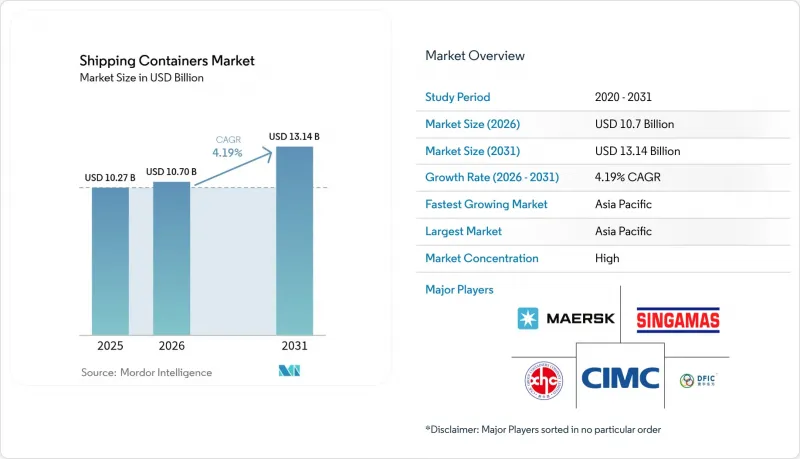
운송 컨테이너 시장 규모는 2026년에 107억 달러로 추정되고 2025년 102억 7,000만 달러에서 확대해, 2031년에는 131억 4,000만 달러 달할 것으로 예측됩니다.
2026년부터 2031년에 걸쳐 연평균 성장률(CAGR) 4.19%로 성장할 것으로 전망됩니다.
본 보고서는 크기별(20피트(TEU), 40피트(FEU) 등), 컨테이너 유형별(드라이 컨테이너(표준), 냉장 컨테이너 등), 재질별(코르텐강, 스테인리스 스틸 등), 최종 이용 산업(소비재 및 소매 등),수송 수단(해상 심해 수송 등), 지역(북미, 남미 등)별로 분류되어 있습니다. 시장 예측은 금액(달러)으로 표시되어 있습니다.
세계의 운송 컨테이너 시장 동향 및 인사이트
국경을 초월한 전자상거래의 폭발적인 성장이 24시간 이내 배송에 대한 기대감을 불러일으키고 있습니다.
전자상거래의 확대로 소량·고빈도 운송이 증가함에 따라, 선박의 적재 능력에서 항만의 처리 속도로 초점이 이동하고 있습니다. 해운사는 고빈도 순환 항로에 선박을 추가 투입하는 한편, 항만은 1교대 근무 시간 내에 선박 하역 작업을 완료할 수 있는 자동 크레인에 투자하고 있습니다. 스마트 추적 시스템을 통해 화주들은 입항 전에 통관 절차를 완료하고 철도 운송 슬롯을 예약할 수 있게 되었습니다. 이러한 업무 효율성 향상으로 재고 주기가 단축되고, 표준 드라이 컨테이너에 대한 선호도가 높아지면서 무역량이 변동하더라도 가동률을 높은 수준으로 유지하고 있습니다. 온라인 마켓플레이스가 신흥 경제국에 확산됨에 따라, 운송 컨테이너 시장에서는 다양한 무역 경로에 걸쳐 지속적인 기초 수요가 나타나고 있습니다.
전 세계 콜드체인의 보급이 첨단 냉장 컨테이너 수주를 가속화하고 있습니다.
제약 제조업체들은 온도 관리를 저해하지 않으면서 비용과 배출량을 줄이기 위해 장거리 운송을 항공 운송에서 해상 운송으로 전환하고 있습니다. 최신 리퍼 컨테이너는 ±0.5℃의 정확도를 유지하며, 편차를 실시간으로 알리는 텔레메트리 기능을 통합하고 있어 항해 중에도 시정 조치를 취할 수 있습니다. 신선 식품 수출업체들도 유사한 기술을 도입하여 부패를 최소화하면서 멀리 떨어진 소비자에게 상품을 배송하고 있습니다. 듀얼 연료식 냉동 장치를 제공하는 제조업체들은 에너지 소비를 줄이고 낮은 GWP 규제를 충족시킴으로써 컨테이너 1개당 가격 인상을 실현하고 있습니다. 식품 전자상거래가 새로운 시장으로 확대됨에 따라, 첨단 냉장 컨테이너에 대한 수요는 일반 화물 성장률을 계속해서 상회하고 있습니다.
팬데믹 이후의 컨테이너 공급 과잉이 가동률을 떨어뜨리고 있다.
2021년부터 2023년에 걸쳐 기록적인 수의 신조 컨테이너가 건조되면서 일시적인 공급 과잉이 발생했고, 이는 임대료 하락을 초래하여 운영사들이 신규 주문을 미루는 사태로 이어지고 있습니다. 무역이 둔화되면 게이트웨이 항구에 유휴 재고가 쌓이고, 창고 운영사는 재고 재배치 업무를 확보하기 위해 보관료를 인하할 수밖에 없게 됩니다. 제조업체들은 생산 라인을 축소하고, 수요가 안정적인 특수 설계 제품으로 생산 능력을 전환함으로써 이에 대응하고 있습니다. 노후화된 선단의 해체가 진행되고 무역이 정상화되면, 이러한 조정 국면은 해소될 것으로 전망됩니다.
부문별 분석
하이큐브형 컨테이너는 13%의 추가 적재 공간을 통해 전자상거래 소포나 경량 가전제품 등 부피가 큰 화물의 적재량을 극대화할 수 있어 증가하는 수요를 확보하고 있습니다. 2025년에는 40피트 규격이 매출의 52.21%를 차지하며 해상 운송에서 꾸준한 인기를 보인 반면, 40피트 하이큐브형 컨테이너는 2031년까지 연평균 성장률(CAGR) 5.43%를 나타낼 것으로 예측됩니다. 하이큐브형 컨테이너 시장 규모는 중량 제한을 초과하지 않으면서 더 큰 적재 용량을 원하는 화주들의 경향을 반영하고 있습니다.
항만 인프라 개선으로 더 높은 적재가 가능해짐에 따라, 터미널 운영사는 이러한 컨테이너를 효율적으로 취급하기 위해 리프팅 높이를 확장한 리치 스태커를 도입하고 있습니다. 물류 통합업체는 철도 화차 배정 및 데포 간 환적을 효율화하기 위해 40피트 규격의 표준화를 추진하고 있습니다. 트리톤 컨테이너스는 재배치를 줄이기 위한 유연한 수거 옵션을 갖춘 하이큐브 컨테이너 임대 서비스를 제공하며, 그 채택을 뒷받침하고 있습니다. 전반적으로, 화주들이 부피 효율과 적재 집약화에 주력함에 따라 주요 무역 회랑 전반에 걸쳐 하이큐브 컨테이너의 지속적인 보급이 촉진되고 있습니다.
2025년 선적량 중 드라이 컨테이너가 72.32%를 차지하며, 세계 상품 유통의 중추로서의 위상을 확고히 했습니다. 대조적으로, 신선식품 수출업체와 제약 제조업체가 해상 운송 경로를 확대함에 따라, 리퍼 컨테이너는 2031년까지 연평균 성장률(CAGR) 6.18%를 기록할 전망입니다. 현재 리퍼 컨테이너는 컨테이너 시장의 프리미엄 부문을 차지하고 있으며, 드라이 컨테이너보다 2-3배 높은 임대료가 책정되어 있습니다.
기술적 개선 사항으로는 가변 속도 압축기나 대기 시 에너지 소비를 줄여주는 태양광 발전 보조 모듈 등이 있습니다. 제약 회사 화주들은 온도 프로브와 도어 센서의 이중화를 요구하며, 온도 편차가 발생할 경우 수 초 이내에 경보를 발령하는 기능을 필요로 하고 있어, 이것이 제조업체 간의 차별화를 촉진하고 있습니다. 또한, 온도에 민감한 화물을 항공 운송에서 해상 운송으로 전환함으로써 관련 배출량을 최대 80%까지 줄일 수 있으므로, 냉장 컨테이너는 탈탄소화의 혜택도 누리고 있습니다.
지역별 분석
아시아태평양은 2025년 매출의 59.88%를 차지하며 컨테이너 시장을 주도했으며, 2031년까지 연평균 성장률(CAGR) 5.46%로 성장할 전망입니다. 중국은 제조 측면에서 주도권을 유지하고 있지만, 기업들이 조달처를 다각화함에 따라 동남아시아가 추가적인 처리량을 확보하고 있습니다. 말레이시아와 인도의 메가 항만 프로젝트로 인해 연간 2,500만 TEU 이상의 처리 능력이 추가되어, 지역 물동량을 뒷받침하는 동시에 피더 네트워크 전반의 컨테이너 수요를 촉진하고 있습니다. 통화 안정과 무역 협정의 지원이 더해지면서, 지역 임대 사업자들은 선단 확대를 추진하고 있습니다.
북미에서는 전자기기 및 자동차 조립을 소비 시장과 가까운 곳으로 이전하는 ‘니어쇼어링’의 혜택을 누리고 있습니다. 미국 항만 당국은 수십억 달러 규모의 준설 및 부두 전기화 계획을 승인하여 멕시코와 캐나다의 관문 항만 대비 경쟁력을 높이고 있습니다. 중서부 전역에 걸친 철도 인터모달 네트워크 구축으로 대서양과 태평양 유역을 8일 이내에 연결하는 비용 대비 효율이 높은 육로 노선이 실현되어, 스택 트레인 대응 컨테이너 설계의 보급을 뒷받침하고 있습니다.
유럽의 컨테이너 시장은 지정학적 긴장으로 인해 아시아-유럽 간 항로가 아프리카 주변으로 우회되어 운송 시간이 연장되는 한편, 지중해의 허브 항구 기항이 증가함에 따라 성장에 편차가 나타나고 있습니다. 런던 게이트웨이 및 로테르담 마스플라흐테에서의 자동화 투자로 인해 크레인 1시간당 처리 능력이 향상되어, 컨테이너 1개당 비용 지표의 악화를 완화하고 있습니다. 엄격한 환경 규제로 인해 낡고 무거운 컨테이너의 퇴역이 가속화되고, 재생 강재를 사용한 컨테이너로의 전환이 진행되고 있어, 무역량 증가세가 둔화되고 있음에도 불구하고 컨테이너 교체 수요를 뒷받침하고 있습니다.
기타 혜택 :
- 엑셀 형식 시장 예측(ME) 시트
- 3개월간의 애널리스트 지원
자주 묻는 질문
목차
제1장 서론
제2장 조사 방법
제3장 주요 요약
제4장 시장 구도
제5장 시장 규모 및 성장 예측
제6장 경쟁 구도
제7장 시장 기회 및 향후 전망
KTH 26.09.04According to Mordor Intelligence, shipping containers market size in 2026 is estimated at USD 10.7 billion, growing from 2025 value of USD 10.27 billion with 2031 projections showing USD 13.14 billion, growing at 4.19% CAGR over 2026-2031.
This report is Segmented by Size (20-Ft (TEU), 40-Ft (FEU) and More), by Container Type (Dry Storage (Standard), Refrigerated, and More), by Material (Corten Steel, Stainless Steel and More), End-Use Industry (Consumer Goods & Retail and More), by Mode of Transport (Maritime Deep-Sea and More), by Geography (North America, South America, and More). The Market Forecasts are Provided in Terms of Value (USD).
Global Shipping Containers Market Trends and Insights
Explosive Growth of Cross-Border E-Commerce Creating 24-Hour Turnaround Expectations
E-commerce expansion drives more frequent, smaller shipments, shifting focus from vessel capacity toward port velocity. Carriers commit additional equipment to high-frequency loops, while ports invest in automated cranes that clear vessels inside one shift. Smart tracking allows shippers to pre-clear customs and book rail slots before docking. These operational gains shorten inventory cycles and reinforce preference for standard dry boxes, keeping utilization high even when trade volumes fluctuate. As online marketplaces penetrate emerging economies, the shipping container market sees sustained baseline demand across diverse trade lanes.
Worldwide Cold-Chain Penetration Accelerates Advanced Reefer Orders
Pharmaceutical producers are migrating long-haul shipments from air to ocean to cut costs and emissions without compromising temperature control. Modern reefers maintain +-0.5 °C accuracy and integrate telemetry that flags deviations in real time, allowing corrective actions mid-voyage. Fresh grocery exporters adopt similar technology to reach distant consumers with minimal spoilage. Manufacturers offering dual-fuel refrigeration units reduce energy consumption and meet low-GWP regulations, enabling higher price realisation per box. As grocery e-commerce extends to new markets, advanced reefer demand continues to outpace general cargo growth.
Post-Pandemic Oversupply of Boxes Eroding Utilization Rates
Record new builds made during 2021-2023 create a temporary surplus, pushing lease rates down and prompting operators to delay fresh orders. Idle inventories accumulate in gateway ports when trade softens, forcing depots to lower storage fees to attract repositioning business. Manufacturers adapt by trimming production shifts and redirecting capacity toward specialized designs with steadier demand. The correction is expected to resolve once scrappage catches up with ageing fleets and trade normalizes.
Other drivers and restraints analyzed in the detailed report include:
- Direct-to-Consumer Brands Demanding Bespoke, Logo-Printed Containers
- Corporate ESG Mandates Pushing Reusable Container Adoption
- Volatility in Hot-Rolled Coil Steel Prices Creating Budget Uncertainty
For complete list of drivers and restraints, kindly check the Table Of Contents.
Segment Analysis
High-cube offerings are capturing incremental demand because their 13% extra headroom maximizes volumetric loads such as e-commerce parcels and lightweight consumer electronics. 40-ft formats generated 52.21% revenue in 2025, demonstrating entrenched popularity for ocean freight, whereas 40-ft high-cube units are forecast to grow at 5.43% CAGR to 2031. The shipping container market size for high-cube units reflects shipper preference for greater capacity without breaching weight restrictions.
Port infrastructure upgrades accommodate taller stacks, and terminal operators add reach-stackers with extended lifting heights to handle these units efficiently. Logistics integrators promote standardization on the 40-ft profile to streamline rail wagon allocation and depot interchange. Triton Containers markets high-cube leases with flexible pick-up options to reduce repositioning, reinforcing adoption. Overall, shipper focus on cubic efficiency and consolidation of packaging drives continued high-cube traction across primary trade corridors.
Dry storage boxes accounted for 72.32% of 2025 shipments, underscoring their status as the backbone of global commodity flows. In contrast, reefer units record a 6.18% CAGR to 2031 as fresh produce exporters and drug makers scale ocean routes. Refrigerated boxes currently represent the premium slice of the shipping container market, commanding rental rates two to three times higher than dry units.
Technology upgrades include variable-speed compressors and solar-assisted power modules that cut energy draw during idle periods. Pharmaceutical shippers require redundant temperature probes and door sensors that trigger alerts within seconds of deviation, driving differentiation among manufacturers. Reefers also benefit from decarbonization, as shifting temperature-sensitive goods from air to sea avoids up to 80% of related emissions.
Complete Report Scope:
- By Size
- 20-ft (TEU)
- 40-ft (FEU)
- 40-ft High-Cube,
- Others ( >45-ft, etc)
- By Container Type
- Dry Storage (Standard)
- Refrigerated (Reefer)
- Tank (ISO Tank, Cryogenic)
- Flat-Rack & Open-Top
- Special Purpose (Side-Door, Tunnel, Insulated, Collapsible)
- By Material
- Corten Steel
- Stainless Steel
- Aluminium Alloy
- FRP & Composite
- Others
- By End-Use Industry
- Consumer Goods & Retail
- Food & Beverage
- Industrial Machinery & Automotive
- Chemicals & Petroleum
- Pharmaceuticals & Healthcare
- Others
- By Mode of Transport
- Maritime Deep-Sea
- Short-Sea & Coastal
- Rail Intermodal
- Road Inland Haulage & Off-Site Storage
- By Geography
- North America
- United States
- Canada
- Mexico
- South America
- Brazil
- Peru
- Chile
- Argentina
- Rest of South America
- Asia-Pacific
- China
- India
- Japan
- Australia
- South Korea
- South East Asia (Singapore, Malaysia, Thailand, Indonesia, Vietnam, and Philippines)
- Rest of Asia-Pacific
- Europe
- United Kingdom
- Germany
- France
- Spain
- Italy
- BENELUX (Belgium, Netherlands, and Luxembourg)
- NORDICS (Denmark, Finland, Iceland, Norway, and Sweden)
- Rest of Europe
- Middle East And Africa
- United Arab Emirates
- Saudi Arabia
- South Africa
- Nigeria
- Rest of Middle East And Africa
- North America
Geography Analysis
Asia-Pacific dominated the shipping containers market with 59.88% revenue in 2025 and is set to grow at a 5.46% CAGR to 2031. China retains manufacturing leadership, yet Southeast Asia captures incremental volumes as firms diversify sourcing. Malaysian and Indian mega-port projects add more than 25 million TEU of annual capacity, anchoring regional throughput and stimulating container demand across feeder networks. Currency stability and supportive trade agreements also encourage regional leasing pools to expand their fleets.
North America benefits from nearshoring that shifts electronics and automotive assembly closer to consumption markets. United States port authorities approve multi-billion-dollar dredging and berth electrification programs, enhancing competitiveness against Mexican and Canadian gateways. The rail intermodal build-out across the Midwest unlocks cost-effective land bridges that connect Atlantic and Pacific basins in under eight days, driving uptake of stack-train compatible container designs.
Europe records mixed growth shipping container market as geopolitical tensions divert Asia-Europe sailings around Africa, extending transit times but also directing additional calls to Mediterranean hubs. Investments in automation at London Gateway and Rotterdam Maasvlakte raise throughput per crane hour, cushioning cost-per-box metrics. Stringent environmental regulations accelerate the retirement of older, heavier boxes in favor of recycled-content steel units, supporting replacement demand despite subdued trade volume growth.
- China International Marine Containers (CIMC)
- Dong Fang International Containers
- CXIC Group (CSSC)
- Maersk Container Industry A/S
- Singamas Container Holdings
- W&K Container
- Sea Box Inc.
- TLS Offshore Containers
- Storstac Inc.
- CARU Containers B.V.
- China Eastern Containers
- Valisons & Co.
- YMC Container Solutions
- American Intermodal Container Manufacturing
- Triton International
- Textainer Group Holdings
- Florens Container Services
- CAI International
- Touax Group
- UES International
Additional Benefits:
- The market estimate (ME) sheet in Excel format
- 3 months of analyst support
TABLE OF CONTENTS
1 Introduction
- 1.1 Study Assumptions & Market Definition
- 1.2 Scope of the Study
2 Research Methodology
3 Executive Summary
4 Market Landscape
- 4.1 Market Overview
- 4.2 Market Drivers
- 4.2.1 Explosive growth of cross-border e-commerce creating 24-hour turnaround expectations for standard dry containers.
- 4.2.2 Worldwide cold-chain penetration of fresh grocery and meal-kit delivery accelerating orders for advanced reefer boxes.
- 4.2.3 Direct-to-consumer (D2C) brands demanding bespoke, logo-printed containers to double as mobile pop-up stores and fulfilment hubs.
- 4.2.4 Corporate ESG mandates pushing shippers toward reusable, multimodal containers over single-use pallet wrap, lifting replacement demand.
- 4.2.5 Adoption of IoT-enabled -smart- boxes providing real-time location & condition data, raising shipper's willingness to pay for premium units.
- 4.2.6 Subscription-based and modular housing concepts spurring second-life conversions of retired shipping containers.
- 4.3 Market Restraints
- 4.3.1 Post-pandemic oversupply of boxes eroding utilisation rates and discouraging new-build investment.
- 4.3.2 Volatility in hot-rolled coil steel prices creating budget uncertainty for container purchasers.
- 4.3.3 Stricter cradle-to-grave regulations and extended-producer-responsibility (EPR) rules inflating lifetime ownership costs.
- 4.3.4 Rapid emergence of foldable and collapsible container alternatives cannibalising demand for conventional rigid boxes.
- 4.4 Value / Supply-Chain Analysis
- 4.5 Regulatory & Technological Outlook
- 4.6 Porter's Five Forces
- 4.6.1 Threat of New Entrants
- 4.6.2 Bargaining Power of Buyers
- 4.6.3 Bargaining Power of Suppliers
- 4.6.4 Threat of Substitutes
- 4.6.5 Intensity of Competitive Rivalry
- 4.7 Pricing Analysis - Standard vs. Special Containers
- 4.8 Spotlight: Intermodal & Rail Uptake
- 4.9 Global Container Leasing Landscape
- 4.10 Impact of Geopolitical Events on the Market
5 Market Size & Growth Forecasts (Value, Volume)
- 5.1 By Size
- 5.1.1 20-ft (TEU)
- 5.1.2 40-ft (FEU)
- 5.1.3 40-ft High-Cube,
- 5.1.4 Others ( >45-ft, etc)
- 5.2 By Container Type
- 5.2.1 Dry Storage (Standard)
- 5.2.2 Refrigerated (Reefer)
- 5.2.3 Tank (ISO Tank, Cryogenic)
- 5.2.4 Flat-Rack & Open-Top
- 5.2.5 Special Purpose (Side-Door, Tunnel, Insulated, Collapsible)
- 5.3 By Material
- 5.3.1 Corten Steel
- 5.3.2 Stainless Steel
- 5.3.3 Aluminium Alloy
- 5.3.4 FRP & Composite
- 5.3.5 Others
- 5.4 By End-Use Industry
- 5.4.1 Consumer Goods & Retail
- 5.4.2 Food & Beverage
- 5.4.3 Industrial Machinery & Automotive
- 5.4.4 Chemicals & Petroleum
- 5.4.5 Pharmaceuticals & Healthcare
- 5.4.6 Others
- 5.5 By Mode of Transport
- 5.5.1 Maritime Deep-Sea
- 5.5.2 Short-Sea & Coastal
- 5.5.3 Rail Intermodal
- 5.5.4 Road Inland Haulage & Off-Site Storage
- 5.6 By Geography
- 5.6.1 North America
- 5.6.1.1 United States
- 5.6.1.2 Canada
- 5.6.1.3 Mexico
- 5.6.2 South America
- 5.6.2.1 Brazil
- 5.6.2.2 Peru
- 5.6.2.3 Chile
- 5.6.2.4 Argentina
- 5.6.2.5 Rest of South America
- 5.6.3 Asia-Pacific
- 5.6.3.1 China
- 5.6.3.2 India
- 5.6.3.3 Japan
- 5.6.3.4 Australia
- 5.6.3.5 South Korea
- 5.6.3.6 South East Asia (Singapore, Malaysia, Thailand, Indonesia, Vietnam, and Philippines)
- 5.6.3.7 Rest of Asia-Pacific
- 5.6.4 Europe
- 5.6.4.1 United Kingdom
- 5.6.4.2 Germany
- 5.6.4.3 France
- 5.6.4.4 Spain
- 5.6.4.5 Italy
- 5.6.4.6 BENELUX (Belgium, Netherlands, and Luxembourg)
- 5.6.4.7 NORDICS (Denmark, Finland, Iceland, Norway, and Sweden)
- 5.6.4.8 Rest of Europe
- 5.6.5 Middle East And Africa
- 5.6.5.1 United Arab Emirates
- 5.6.5.2 Saudi Arabia
- 5.6.5.3 South Africa
- 5.6.5.4 Nigeria
- 5.6.5.5 Rest of Middle East And Africa
- 5.6.1 North America
6 Competitive Landscape
- 6.1 Market Concentration
- 6.2 Strategic Moves (M&A, Capacity Expansion, Leasing Deals)
- 6.3 Market Share Analysis
- 6.4 Company Profiles (includes Global-level Overview, Market-level Overview, Core Segments, Financials, Strategic Information, Market Rank/Share, Products & Services, Recent Developments)
- 6.4.1 China International Marine Containers (CIMC)
- 6.4.2 Dong Fang International Containers
- 6.4.3 CXIC Group (CSSC)
- 6.4.4 Maersk Container Industry A/S
- 6.4.5 Singamas Container Holdings
- 6.4.6 W&K Container
- 6.4.7 Sea Box Inc.
- 6.4.8 TLS Offshore Containers
- 6.4.9 Storstac Inc.
- 6.4.10 CARU Containers B.V.
- 6.4.11 China Eastern Containers
- 6.4.12 Valisons & Co.
- 6.4.13 YMC Container Solutions
- 6.4.14 American Intermodal Container Manufacturing
- 6.4.15 Triton International
- 6.4.16 Textainer Group Holdings
- 6.4.17 Florens Container Services
- 6.4.18 CAI International
- 6.4.19 Touax Group
- 6.4.20 UES International
7 Market Opportunities & Future Outlook
- 7.1 White-Space & Unmet-Need Assessment