|
시장보고서
상품코드
2120812
북미의 유리병 및 용기 시장 : 시장 점유율 분석, 업계 동향 및 통계, 성장 예측(2026-2031년)North America Glass Bottles And Containers - Market Share Analysis, Industry Trends & Statistics, Growth Forecasts (2026 - 2031) |
||||||
 Mordor Intelligence
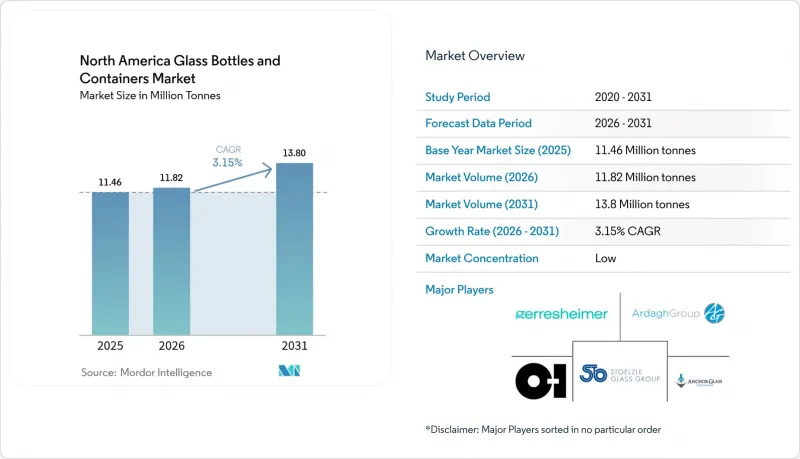
Mordor Intelligence에 의하면, 2026년 북미의 유리병 및 용기 시장 규모는 1,182만 톤으로 추정되고, 2025년 1,146만 톤으로부터 확대해, 2031년에는 1,380만 톤에 이를 것으로 예측됩니다.
2026-2031년 연평균 성장률(CAGR) 3.15%로 성장할 것으로 전망됩니다.
본 보고서는 최종 사용자별(음료(주류(맥주, 와인, 증류주, 기타 주류) 및 무알코올 음료(탄산음료(CSD), 유제품 베이스 음료 등)), 식품(잼·젤리, 조미료·소스 등), 화장품 및 퍼스널케어, 기타), 색상별(플린트, 앰버, 기타)로 분류되어 있습니다. 시장 예측은 수량(톤) 기준으로 제시되어 있습니다.
북미의 유리병 및 용기 시장 동향 및 인사이트
전자상거래의 성장이 내구성이 뛰어난 고급 포장재에 대한 수요를 견인
미국의 온라인 소매 취급량은 2024년부터 2029년 사이에 53% 급증할 것으로 예상되며, 각 브랜드는 제품의 미관을 유지하면서도 다단계 운송을 견딜 수 있는 견고한 솔루션을 찾고 있습니다. 유리병은 이러한 두 가지 요건을 모두 충족합니다. 압축력을 견딜 뿐만 아니라, 독특한 ‘개봉’의 순간을 연출하여 소비자 직접 판매(D2C)에서의 충성도를 강화합니다. 구독 박스에서 흔히 볼 수 있는 화장품, 장인이 만든 조미료, 틈새 시장 음료 등은 현재 파손을 최소화하기 위해 경량 유리 용기와 결합된 맞춤형 보호 인서트를 지정하고 있습니다. 풀필먼트 센터에서는 표준 250mL 및 500mL 병의 형태에 맞추어 조정된 자동 공극 충전 라인의 도입이 진행되고 있으며, 이를 통해 취급 비용이 절감되고 있습니다. 라스트 마일 배송 네트워크에서 온도 관리 서비스가 정교해짐에 따라, 콜드체인 음료 유통업체들은 다층 플라스틱에 의존하지 않고도 프리미엄 포지셔닝을 유지할 수 있게 되었습니다. 물류 최적화와 소비자 인식이 맞물리면서, 북미 유리병 및 용기 시장에서 유리는 주류 용기로서의 입지를 확고히 하고 있습니다.
크래프트 음료의 붐이 맞춤형 유리병에 대한 수요를 뒷받침하고 있습니다.
미국에서는 2024년 한 해에만 300개 이상의 증류소와 250개 이상의 지역 맥주 양조장이 새로 설립되었으며, 각 업체는 지역 고유의 정체성과 매장 내 차별화를 중시하고 있습니다. 엠보싱 처리된 로고, 불규칙한 어깨 부분의 형태, 코르크 마감 처리된 목 부분은 시음실에서 가격 프리미엄을 창출하는 상징적인 특징이 되고 있습니다. 한때는 50만 개 이상의 생산량이어야만 수익성을 확보할 수 있었던 맞춤형 금형도, 모듈식 금형과 블랭크 3D 모래 주조 기술 덕분에 현재는 5만 개 생산으로도 경제적으로 제조가 가능해졌습니다. 캐나다의 사이다 제조업체들도 이러한 추세를 따라, 자외선 차단 기능과 투명함의 매력을 겸비한 착색된 플린트 유리와 앰버 유리의 하이브리드 제품을 수입하고 있습니다. 켄튀르키예주, 미주리주, 온타리오주의 지역 유리 공장은 리드타임 단축이라는 혜택을 누리고 있으며, 이를 통해 운송에 따른 배출량을 줄이고 지속가능성 노력을 강화하고 있습니다. 이러한 요인들이 결합되어 북미 유리병 및 용기 시장에서 맞춤형 형태의 제품에 대한 부가가치가 향상되고 있습니다.
재활용 인프라 부족으로 인해 유리 파편(컬릿)공급이 제한되고 있습니다.
유리 회수율은 오리건주의 73%에서 일리노이주의 8%까지 편차가 있어, 신뢰할 수 있는 2차 원료 공급원을 제한하고 있습니다. 지방 도시에서는 수거 거점이 부족한 경우가 많아, 운송업체들은 색이 섞인 유리 파편을 매립 처분할 수밖에 없는 상황입니다. Strategic Materials Inc.는 42곳의 처리 공장을 운영하고 있지만, 그럼에도 미국 카운티의 절반도 채 커버하지 못하고 있습니다. 칼렛 공급이 감소하면 배치는 버진 소다-석회 유리로 되돌아가며, 이로 인해 연료 사용량이 15% 증가하고 탄소 배출 효율이 저하됩니다. 태평양 연안 북서부처럼 서비스 체계가 잘 갖춰진 지역에 위치한 제조업체는 중서부 지역의 동종 업계 경쟁사에 비해 톤당 15달러의 비용 우위를 누리고 있어, 북미 유리병 및 용기 시장의 지역 간 불균형을 더욱 악화시키고 있습니다.
부문 분석
2025년, 북미 유리병 및 용기 시장에서 음료 제조업체 대상 매출은 61.02%를 차지했습니다. 이는 크래프트 맥주, 프리미엄 증류주, 기능성 음료의 소비가 정착되었기 때문입니다. 주류 포장재에 대한 플라스틱 사용 규제로 인해, 풍미 유지 및 브랜드 전통을 전달하는 수단으로서 유리가 기본 선택지로 더욱 자리 잡고 있습니다. 이 부문은 SKU 증가가 주류인 맥주의 판매량 정체 현상을 상쇄할 것으로 예상되어, 한 자릿수 초반의 안정적인 성장세를 보일 것으로 전망됩니다. 프리미엄 믹서 및 RTD(Ready-to-Drink) 칵테일의 경우, 기존에는 증류주 전용으로 여겨졌던 플루티드 넥(홈이 파인 목 부분) 디자인이나 엠보싱 가공이 채택되어 평균 판매 가격을 끌어올리고 있습니다. 화장품 및 퍼스널케어 분야는 시장 규모는 작지만, 2031년까지 연평균 성장률(CAGR) 3.6%를 나타낼 것으로 예측되며, 북미 유리병 및 용기 시장의 다른 모든 최종 용도를 능가하는 속도로 성장할 것으로 전망됩니다. 고급 스킨케어 브랜드는 중후함과 재사용성을 전달하는 두꺼운 용기를 중시하고 있으며, 고급 백화점에 설치된 리필 스테이션이 재방문을 촉진하고 있습니다.
의약품 분야 수요는 Type I 붕규산 바이알의 검증 절차를 간소화하는 FDA의 2024년 통합 지침의 혜택을 받고 있습니다. 이에 따라 위탁 개발·제조 기관(CDMO)은 바이알 제품군을 확대하고 있으며, 이는 의료용 유리 생산을 촉진하고 있습니다. 고급 잼, 딥 소스, 냉압착 오일 등의 식품 부문은 투명한 유리를 활용해 자연스러운 질감을 부각시키고 장인의 솜씨를 강조함으로써 틈새 시장의 성장을 유지하고 있습니다. 전반적으로, 이러한 각 분야에서의 다양한 수요 증가가 북미 유리병 및 용기 시장 규모의 장기적인 안정성을 뒷받침하고 있습니다.
기타 혜택 :
- 엑셀 형식 시장 예측(ME) 시트
- 3개월간의 애널리스트 지원
자주 묻는 질문
목차
제1장 서론
제2장 조사 방법
제3장 주요 요약
제4장 시장 구도
제5장 시장 규모 및 성장 예측
제6장 경쟁 구도
제7장 시장 기회 및 향후 전망
AJY 26.09.09According to Mordor Intelligence, North America glass bottles and Containers Market size in 2026 is estimated at 11.82 million tonnes, growing from 2025 value of 11.46 million tonnes with 2031 projections showing 13.8 million tonnes, growing at 3.15% CAGR over 2026-2031.

This report is Segmented by End-User (Beverages [Alcoholic {Beer, Wine, Spirits, Other Alcoholic Beverages}, and Non-Alcoholic {Carbonated Drinks (CSDs), Dairy Product Based Drinks, and More}], Food [Jam and Jelly, Condiments and Sauces, and More], Cosmetics and Personal Care, and More), Color (Flint, Amber, and More). The Market Forecasts are Provided in Terms of Volume (Tonnes).
North America Glass Bottles And Containers Market Trends and Insights
E-commerce growth drives demand for durable, premium packaging
U.S. online retail volume is expected to jump 53% between 2024 and 2029, compelling brands to seek rigid solutions that survive multi-stage shipping while preserving product aesthetics. Glass bottles satisfy both requirements; they resist compression forces and create a signature "unboxing" moment that strengthens direct-to-consumer loyalty. Cosmetics, artisanal condiments, and niche beverages, all common in subscription boxes, now specify custom protective inserts that pair with lightweight glass formats to minimize breakage. Fulfillment centers increasingly incorporate automated void-fill lines calibrated for standard 250-mL and 500-mL bottle footprints, lowering handling costs. As last-mile networks refine temperature-controlled services, cold-chain beverage sellers can maintain premium positioning without resorting to multilayer plastics. Together, logistics optimization and consumer perception cement glass as the go-to vessel within the North America glass bottles and containers market.
Craft beverage boom fuels demand for custom glass bottles
The United States added more than 300 distilleries and 250 microbreweries in 2024 alone, each emphasizing localized identity and shelf differentiation. Embossed logos, non-uniform shoulder profiles, and cork-finish necks have become hallmark cues that command pricing premiums in tasting rooms. Custom molds, once viable only above 500,000-unit runs, are now economical at 50,000 units thanks to modular tooling and 3-D sand-printing of blanks. Canadian cideries echo the trend, importing colored flint/amber hybrids that blend UV protection with see-through appeal. Regional glasshouses in Kentucky, Missouri, and Ontario benefit from short lead times, cutting freight emissions and reinforcing sustainability stories. These factors combine to lift value throughput for customized formats inside the North America glass bottles and containers market.
Recycling infrastructure gaps limit cullet availability
Glass collection varies from Oregon's 73% to Illinois's 8%, constraining a reliable secondary feedstock stream. Rural towns often lack drop-off depots, forcing haulers to landfill mixed-color cullet. Strategic Materials Inc. runs 42 processing plants, yet still covers fewer than half of the U.S. counties. When cullet supply dips, batch recipes revert to virgin soda-lime, raising fuel use by 15% and eroding carbon credentials. Manufacturers in well-served corridors like the Pacific Northwest enjoy cost advantages of USD 15 per ton over Midwest peers, exacerbating regional imbalances inside the North America glass bottles and containers market.
Other drivers and restraints analyzed in the detailed report include:
- Sustainability push and recyclability favor glass over plastic
- Extended Producer Responsibility programs promote glass adoption
- Weight and fragility increase last-mile delivery costs
For complete list of drivers and restraints, kindly check the Table Of Contents.
Segment Analysis
Sales to beverage producers represented 61.02% of the North America glass bottles and containers market in 2025, thanks to entrenched craft-beer, premium-spirits, and functional-drink consumption. Regulatory limits on plastics in alcoholic packaging further entrench glass as the default for flavor preservation and brand heritage storytelling. The segment is projected to chart stable low-single-digit gains as SKU proliferation offsets plateauing mainstream beer volumes. Premium mixers and ready-to-drink cocktails tap fluted neck designs and embossing cues previously reserved for spirits, elevating average selling prices. Cosmetics and personal care, while having a smaller base, are forecast to post a 3.6% CAGR through 2031, outpacing all other end-uses within the North America glass bottles and containers market. Luxury skincare labels emphasize thick-walled jars that convey heft and reusability; refill stations in prestige department stores spur repeat visits.
Pharmaceutical demand benefits from the FDA's 2024 consolidated guidance, which streamlines validation for Type I borosilicate vials. Contract development and manufacturing organizations (CDMOs) therefore broaden vial portfolios, lifting medical-grade glass production. Food segments such as gourmet jams, dipping sauces, and cold-pressed oils sustain niche growth, leveraging transparent glass to showcase natural textures and reinforce artisanal positioning. Collectively, diversified uptake across these verticals underpins long-term stability for the North America glass bottles and containers market size.
Complete Report Scope:
- By End-user
- Beverages
- Alcoholic
- Beer
- Wine
- Spirits
- Other Alcoholic Beverages (Cider and Other Fermented Drinks)
- Non-Alcoholic
- Juices
- Carbonated Drinks (CSDs)
- Dairy Product Based Drinks
- Other Non-Alcoholic Beverages
- Alcoholic
- Food (Jam, Jelly, Marmalades, Honey, Sausages and Condiments, Oil, Pickles)
- Cosmetics and Personal Care
- Pharmaceuticals (excluding Vials and Ampoules)
- Perfumery
- Beverages
- By Color
- Green
- Amber
- Flint
- Other Colors
- By Country
- United States
- Canada
- Mexico
List of Companies Covered in this Report:
- O-I Glass, Inc.
- Ardagh Group S.A.
- Anchor Glass Container Corporation
- Gerresheimer AG
- Stoelzle Glass Group
- Berlin Packaging LLC
- TricorBraun Inc.
- Kaufman Container
- O.Berk Company, LLC
- MJS Packaging
- Burch Bottle & Packaging, Inc.
- General Bottle Supply
- Pacific Vial Manufacturing Inc.
- North Mountain Supply
- Silver Spur Corporation
- Glassnow, Inc.
- Love Bottle LLC
- Vitro Packaging LLC
- Gallo Glass Company
- The Cary Company
Additional Benefits:
- The market estimate (ME) sheet in Excel format
- 3 months of analyst support
TABLE OF CONTENTS
1 INTRODUCTION
- 1.1 Study Assumptions and Market Definition
- 1.2 Scope of the Study
2 RESEARCH METHODOLOGY
3 EXECUTIVE SUMMARY
4 MARKET LANDSCAPE
- 4.1 Market Overview
- 4.2 Market Drivers
- 4.2.1 E-Commerce Growth Drives Demand for Durable, Premium Packaging
- 4.2.2 Craft Beverage Boom Fuels Demand for Custom Glass Bottles
- 4.2.3 Sustainability Push and Recyclability Favor Glass Over Plastic
- 4.2.4 Extended Producer Responsibility (EPR) Programs Promote Glass Adoption
- 4.2.5 Embossing and Artistic Finishes Enhance Brand Differentiation
- 4.2.6 Consumer Shift Toward Healthier Packaging Fuels Glass Preference
- 4.3 Market Restraints
- 4.3.1 Recycling Infrastructure Gaps Limit Cullet Availability
- 4.3.2 Weight and Fragility Increase Last-Mile Delivery Costs
- 4.3.3 Plastic and Metal Packaging Continue to Dominate Mass SKUs
- 4.3.4 High Furnace Energy Requirements Raise Carbon Exposure
- 4.4 Industry Supply-Chain Analysis
- 4.5 Container Glass Furnace Capacity and Locations in North America
- 4.5.1 Plant Locations and Year of Commencement
- 4.5.2 Production Capacities
- 4.5.3 Types of Furnaces
- 4.5.4 Color of Glass Produced
- 4.6 Export-Import Data of Container Glass - Covering Key Import and Export Destinations
- 4.6.1 Import Volume and Value, 2021-2024
- 4.6.2 Export Volume and Value, 2021-2024
- 4.7 Porter's Five Forces Analysis
- 4.7.1 Threat of New Entrants
- 4.7.2 Bargaining Power of Suppliers
- 4.7.3 Bargaining Power of Buyers
- 4.7.4 Threat of Substitutes
- 4.7.5 Competitive Rivalry
- 4.8 Raw Material Analysis
- 4.9 Recycling Trends for Glass Packaging
- 4.10 Demand vs Supply Analysis for Glass Packaging
5 MARKET SIZE AND GROWTH FORECASTS (VOLUME)
- 5.1 By End-user
- 5.1.1 Beverages
- 5.1.1.1 Alcoholic
- 5.1.1.1.1 Beer
- 5.1.1.1.2 Wine
- 5.1.1.1.3 Spirits
- 5.1.1.1.4 Other Alcoholic Beverages (Cider and Other Fermented Drinks)
- 5.1.1.2 Non-Alcoholic
- 5.1.1.2.1 Juices
- 5.1.1.2.2 Carbonated Drinks (CSDs)
- 5.1.1.2.3 Dairy Product Based Drinks
- 5.1.1.2.4 Other Non-Alcoholic Beverages
- 5.1.1.1 Alcoholic
- 5.1.2 Food (Jam, Jelly, Marmalades, Honey, Sausages and Condiments, Oil, Pickles)
- 5.1.3 Cosmetics and Personal Care
- 5.1.4 Pharmaceuticals (excluding Vials and Ampoules)
- 5.1.5 Perfumery
- 5.1.1 Beverages
- 5.2 By Color
- 5.2.1 Green
- 5.2.2 Amber
- 5.2.3 Flint
- 5.2.4 Other Colors
- 5.3 By Country
- 5.3.1 United States
- 5.3.2 Canada
- 5.3.3 Mexico
6 COMPETITIVE LANDSCAPE
- 6.1 Market Concentration
- 6.2 Strategic Moves and Developments
- 6.3 Company Market Share Analysis, (Based on Latest Production Capacity)
- 6.4 Company Profiles (includes Global level Overview, Market level overview, Core Segments, Financials as available, Strategic Information, Market Rank/Share for key companies, Products and Services, and Recent Developments)
- 6.4.1 O-I Glass, Inc.
- 6.4.2 Ardagh Group S.A.
- 6.4.3 Anchor Glass Container Corporation
- 6.4.4 Gerresheimer AG
- 6.4.5 Stoelzle Glass Group
- 6.4.6 Berlin Packaging LLC
- 6.4.7 TricorBraun Inc.
- 6.4.8 Kaufman Container
- 6.4.9 O.Berk Company, LLC
- 6.4.10 MJS Packaging
- 6.4.11 Burch Bottle & Packaging, Inc.
- 6.4.12 General Bottle Supply
- 6.4.13 Pacific Vial Manufacturing Inc.
- 6.4.14 North Mountain Supply
- 6.4.15 Silver Spur Corporation
- 6.4.16 Glassnow, Inc.
- 6.4.17 Love Bottle LLC
- 6.4.18 Vitro Packaging LLC
- 6.4.19 Gallo Glass Company
- 6.4.20 The Cary Company
7 MARKET OPPORTUNITIES AND FUTURE OUTLOOK
- 7.1 White-space and Unmet-Need Assessment