|
시장보고서
상품코드
2124534
아프리카의 유리병 및 용기 : 시장 점유율 분석, 산업 동향 및 통계 데이터, 성장 예측(2026-2031년)Africa Glass Bottles And Containers - Market Share Analysis, Industry Trends & Statistics, Growth Forecasts (2026 - 2031) |
||||||
 Mordor Intelligence
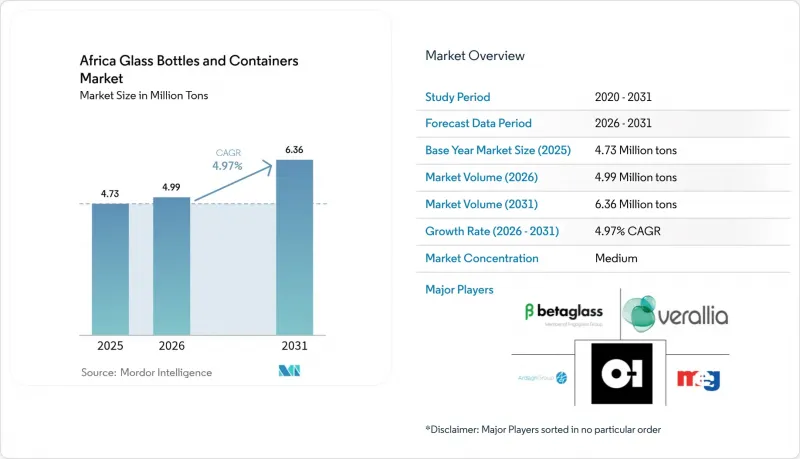
Mordor Intelligence에 의하면, 아프리카의 유리병 및 용기 시장 규모는 2025년 473만 톤으로 평가되었습니다. 2026년 499만 톤으로부터, 2031년까지 636만 톤으로 확대되고 2026년부터 2031년까지 연평균 복합 성장률(CAGR)은 4.97%를 나타낼 전망입니다.
본 보고서는 최종 사용자별(음료, 식품, 화장품 및 퍼스널케어 등), 색상별(플린트, 호박색, 녹색 등), 지역별(이집트, 나이지리아, 케냐 등)로 분류되어 있습니다. 시장 예측은 수량(톤) 단위로 제시되어 있습니다.
아프리카의 유리병 및 용기 시장 동향 및 인사이트
음료 소비 증가와 프리미엄 패키지에 대한 수요
아프리카에서 브랜드 맥주, 증류주, 탄산 청량음료에 대한 수요가 가속화되고 있으며, 이러한 추세는 인구 증가율을 훨씬 웃도는 속도로 고부가가치 유리 제품에 대한 수요를 끌어올리고 있습니다. 이스트 아프리카 브루어리즈(East Africa Breweries)는 2024-2025 회계연도에 1,700만 병 이상의 반환 가능한 병을 회수했습니다. 이는 물이나 주스 분야에서 PET가 널리 보급되고 있음에도 불구하고, 재충전 가능한 유리 용기가 여전히 맥주 산업의 핵심으로 남아 있음을 보여주는 증거입니다. 케냐의 프로세라 진(Procera Gin)과 같은 수제 증류주 제조업체들은 현재 엠보싱, 스크린 인쇄, 맞춤형 캡을 지정하고 있으며, 이로 인해 가공업체들은 단위당 이익률이 높은 소량 생산으로 전환하고 있습니다. 서아프리카에서는 베타 글라스(Beta Glass)가 2025년 상반기 782억 나이라(9,740만 달러)의 매출을 기록하며, 음료 충전 업체들의 안정적인 수요가 확산되고 있음을 입증했습니다. 중산층이 성숙해지고 소비의 프리미엄화가 진행됨에 따라, 이러한 요인으로 인해 기준 연평균 성장률(CAGR)에 약 1.2퍼센트 포인트가 추가될 것으로 예측됩니다.
식품용 및 재활용 가능한 포장재에 대한 규제 강화
각국 정부는 폐기 및 안전 기준을 강화하고 있으며, 시장 환경은 무한히 재활용 가능한 유리로 기울고 있습니다. 케냐의 2024년 EPR(생산자 책임 확대) 규정에 따라 유리 제품 1개당 150 케냐 실링의 수입세가 도입되었으며, 생산자에게는 회수 제도 시행이 의무화되었습니다. 이에 따라 저가 수입품으로부터 국내 생산품이 사실상 보호되게 되었습니다. 남아프리카공화국의 타당성 조사에 따르면, 1랜드의 보증금을 도입함으로써 회수율을 90%까지 끌어올리고, 약 30만 5,000-47만 7,000톤의 폐기물을 매립지에서 전환할 수 있는 것으로 나타났습니다. 아프리카 연합의 ‘2024-2034년 순환형 경제 행동 계획’에서는 재활용률 30%라는 목표가 설정되어 있으며, 이에 따라 제조업체들은 유리 파편 처리 인프라를 확대할 자신감을 얻고 있습니다. 이러한 조치로 인해 연평균 성장률(CAGR)이 0.9포인트 상승할 것으로 예측되며, 이미 규제 시행이 진행 중인 케냐와 남아프리카공화국에서는 초기 단계에서 가장 두드러진 성장이 예상됩니다.
PET 및 알루미늄 경량 용기의 보급
더 저렴하고 가벼운 플라스틱 및 캔이 청량음료, 생수, 보급형 와인 시장에서 점유율을 확대되고 있습니다. 코카콜라 헬레닉 보틀링 컴퍼니는 연간 1만 3,000톤의 식품 등급 rPET로 전환이 가능한 라고스 PET 허브를 개설하여, 테이크아웃 채널에서 브랜드 소유주들의 일회용 플라스틱 선호도를 강화하고 있습니다. 국제알루미늄협회(International Aluminium Institute)의 최근 조사에 따르면, 단위당 비용과 배출량 양면에서 유리가 최상위권을 차지하여 음료 제조업체들의 다각화 전략이 뒷받침되고 있습니다. 2023년에는 남아프리카공화국 국내 와인 포장 시장의 49.4%를 이미 백인박스(Bag-in-Box)가 차지해, 유리 용기 대체가 가속화될 것이라는 압력이 커지고 있음이 드러났습니다. 이러한 요인들이 복합적으로 작용하여 단기적으로는 연평균 성장률(CAGR)을 0.8포인트 끌어내릴 것으로 예측됩니다.
부문별 분석
2025년 판매량 중 음료가 72.12%를 차지하며, 아프리카의 유리병 및 용기 시장에서 주도적인 입지를 확고히 했습니다. 맥주가 가장 큰 하위 카테고리이지만, 프리미엄 증류주와 와인은 특히 수출 지향성이 강한 남아프리카공화국의 웨스트케이프 주에서 더 높은 단위 이익률을 유지하고 있습니다. 이스트 아프리카 브루어리(East Africa Breweries)가 2024-2025 회계연도에 1,700만 병 이상의 반환 가능한 병을 회수한 것은 일회용 제품보다 유리를 선호하는 재충전 가능한 순환 시스템이 정착되어 있음을 보여줍니다. 무알코올 음료 브랜드는 저가 제품군에서 여전히 PET에 의존하고 있지만, 프리미엄 주스 포장재로는 리브가 있는 유리병이 여전히 주류를 이루고 있습니다.
화장품 및 퍼스널케어 시장은 2031년까지 연평균 5.88%의 성장이 예상되며, 이는 모든 용도 중 가장 높은 성장률입니다. 가처분 소득 증가, 온라인 뷰티 시장의 급속한 확산, 그리고 향수나 에센스에서 유리가 주는 고급스러움이 수요를 뒷받침하고 있습니다. 아랍 제약 유리 회사(Arab Pharmaceutical Glass Company)는 3기의 용해로를 가동하여 제약 및 미용 업계 고객을 대상으로 하루 125만 개의 용기를 생산하고 있으며, 이는 해당 지역 내에서 품질 인증을 받은 공급이 가능함을 보여줍니다. 세계적인 전문 기업인 게레스하이머(Geresheimer)가 성형 유리 사업을 매각함에 따라, 지역 가공업체들은 생산 능력의 공백을 메우고 리드타임을 단축할 수 있는 좋은 기회로 보고 있습니다.
기타 혜택 :
- 엑셀 형식 시장 예측(ME) 시트
- 3개월간의 애널리스트 지원
자주 묻는 질문
목차
제1장 서론
제2장 분석 방법
제3장 주요 요약
제4장 시장 구도
제5장 시장 규모 및 성장률 예측
제6장 경쟁 구도
제7장 시장 기회 및 향후 전망
KTH 26.09.14According to Mordor Intelligence, the Africa glass bottles and Containers Market size is projected to expand from 4.73 Million tons in 2025 and 4.99 Million tons in 2026 to 6.36 Million tons by 2031, registering a CAGR of 4.97% between 2026 to 2031.

This report is Segmented by End-User (Beverages, Food, Cosmetics and Personal Care, and More), Color (Flint, Amber, Green, and More), and Geography (Egypt, Nigeria, Kenya, and More). The Market Forecasts are Provided in Terms of Volume (Tons).
Africa Glass Bottles And Containers Market Trends and Insights
Rising Beverage Consumption and Premium-Packaging Demand
Africa's accelerating thirst for branded beer, spirits, and carbonated soft drinks is lifting high-value glass demand far faster than headline population growth. East African Breweries recovered more than 17 million returnable bottles in fiscal 2024-2025, evidence that refillable glass stays core to beer economics even as PET advances in water and juice. Craft distillers such as Kenya's Procera Gin now specify embossing, screen-printing, and bespoke closures, pushing converters toward shorter production runs with higher unit margins. In West Africa, Beta Glass booked NGN 78.2 billion (USD 97.4 million) first-half 2025 revenue, underscoring steady pull-through from beverage fillers. As middle-income cohorts mature and premiumize consumption, this driver is expected to add about 1.2 percentage points to the baseline CAGR.
Regulatory Push For Food-grade, Recyclable Packaging
Governments are tightening disposal and safety standards, tilting the playing field toward infinitely recyclable glass. Kenya's 2024 EPR rules introduced a KSh 150 import levy on each glass item and mandated producers to take-back schemes, effectively shielding local output from low-cost imports. A South African feasibility study showed that a ZAR 1 deposit can raise collection to 90%, diverting roughly 305,000-477,000 tons from landfills. The African Union's 2024-2034 Circular Economy Action Plan fixes a 30% recycling target, giving manufacturers confidence to scale cullet infrastructure. These steps are forecast to lift the CAGR by 0.9 percentage points, with the sharpest early gains in Kenya and South Africa, where enforcement is already visible.
Proliferation of PET and aluminium lightweight formats
Cheaper, lighter plastics and cans are capturing share in soft drinks, water, and entry-level wine. Coca-Cola Hellenic Bottling Company opened a Lagos PET hub capable of converting 13,000 tons annually into food-grade rPET, intensifying brand owner preference for single-trip plastic in on-the-go channels. A recent International Aluminium Institute study placed glass at the top of the cost and emissions ladder per unit, reinforcing beverage firms' multiformat hedging. Bag-in-box already accounted for 49.4% of South African domestic wine packaging in 2023, underscoring the pressure on glass displacement. Collectively, these forces are expected to dilute CAGR by 0.8 percentage points over the near term.
Other drivers and restraints analyzed in the detailed report include:
- Urban Middle-class Expansion Boosting Beer And CSD Volumes
- AfCFTA-driven Intra-Africa Trade In Glass-packaged Goods
- High Energy-input And Power-reliability Costs
For complete list of drivers and restraints, kindly check the Table Of Contents.
Segment Analysis
Beverages accounted for 72.12% of 2025 volume, anchoring the Africa glass bottles and containers market leadership stack. Beer is the single largest sub-category, but premium spirits and wine sustain higher unit margins, especially in South Africa's export-focused Western Cape. East African Breweries' recovery of more than 17 million returnable bottles in fiscal 2024-2025 signals the entrenched dominance of refillable loops that favor glass over disposables. Non-alcoholic brands still lean on PET for value lines, though fluted glass remains the packaging of choice for premium juices.
Cosmetics and personal care is projected to grow at 5.88% through 2031, the fastest among all uses. Rising disposable income, strong adoption of online beauty, and the cachet of glass in fragrance and serums underpin demand. Arab Pharmaceutical Glass Company operates three furnaces, producing 1.25 million containers a day for pharma and beauty clients, demonstrating that quality-certified supply is available in-region. With global specialist Gerresheimer divesting its moulded-glass unit, regional converters see an opportunity to fill capability gaps and shorten lead times.
Complete Report Scope:
- By End-user
- Beverages
- Alcoholic
- Beer
- Wine
- Spirits
- Other Alcoholic Beverages (Cider and Other Fermented Drinks)
- Non-Alcoholic
- Juices
- Carbonated Drinks (CSDs)
- Dairy Product Based Drinks
- Other Non-Alcoholic Beverages
- Alcoholic
- Food (Jam, Jelly, Marmalades, Honey, Sausages and Condiments, Oil, Pickles)
- Cosmetics and Personal Care
- Pharmaceuticals (excluding Vials and Ampoules)
- Perfumery
- Beverages
- By Color
- Green
- Amber
- Flint
- Other Colors
- By Country
- Egypt
- Nigeria
- Kenya
- Morocco
- South Africa
- Rest of Africa
List of Companies Covered in this Report:
- Ardagh Group S.A.
- Beta Glass PLC
- Consol Glass Pty Ltd
- O-I Glass, Inc.
- Verallia Packaging S.A.S.
- Isanti Glass 1 (Pty) Ltd
- Kandil Glass
- Middle East Glass Manufacturing Company S.A.E.
- Saverglass SAS
- African Glass Limited
- The National Company for Glass and Crystal S.A.E.
- Gerresheimer AG
- Arab Pharmaceutical Glass Company S.A.E.
- Dalgen Packaging CC
- Nampak Limited
- United Glass Containers Company (UGC)
- Societe d'Exploitation de Verreries au Maroc (SEVAM)
Additional Benefits:
- The market estimate (ME) sheet in Excel format
- 3 months of analyst support
TABLE OF CONTENTS
1 INTRODUCTION
- 1.1 Study Assumptions and Market Definition
- 1.2 Scope of the Study
2 RESEARCH METHODOLOGY
3 EXECUTIVE SUMMARY
4 MARKET LANDSCAPE
- 4.1 Market Overview
- 4.2 Market Drivers
- 4.2.1 Rising Beverage Consumption and Premium-Packaging Demand
- 4.2.2 Regulatory Push for Food-grade, Recyclable Packaging
- 4.2.3 Urban Middle-class Expansion Boosting Beer and CSD Volumes
- 4.2.4 AfCFTA-driven Intra-Africa Trade in Glass-packaged Goods
- 4.2.5 Craft Alcohol and Artisan Spirits Boom (Short-run Premium Glass)
- 4.2.6 EU CBAM Pressure on Low-carbon Export Packaging
- 4.3 Market Restraints
- 4.3.1 Proliferation of PET and Aluminium Lightweight Formats
- 4.3.2 High Energy-input and Power-reliability Costs
- 4.3.3 Limited Food-grade Cullet Availability Due to Inefficient Collection Networks
- 4.3.4 Currency Volatility and Soda-ash Import Tariffs
- 4.4 Industry Supply-Chain Analysis
- 4.5 Container Glass Furnace Capacity and Locations in Africa
- 4.5.1 Plant Locations and Year of Commencement
- 4.5.2 Production Capacities
- 4.5.3 Types of Furnaces
- 4.5.4 Color of Glass Produced
- 4.6 Export-Import Data of Container Glass - Covering Key Import and Export Destinations
- 4.6.1 Import Volume and Value, 2022-2025
- 4.6.2 Export Volume and Value, 2022-2025
- 4.7 Porter's Five Forces Analysis
- 4.7.1 Threat of New Entrants
- 4.7.2 Bargaining Power of Suppliers
- 4.7.3 Bargaining Power of Buyers
- 4.7.4 Threat of Substitutes
- 4.7.5 Competitive Rivalry
- 4.8 Raw Material Analysis
- 4.9 Recycling Trends for Glass Packaging
- 4.10 Demand vs Supply Analysis for Glass Packaging
5 MARKET SIZE AND GROWTH FORECASTS (VOLUME)
- 5.1 By End-user
- 5.1.1 Beverages
- 5.1.1.1 Alcoholic
- 5.1.1.1.1 Beer
- 5.1.1.1.2 Wine
- 5.1.1.1.3 Spirits
- 5.1.1.1.4 Other Alcoholic Beverages (Cider and Other Fermented Drinks)
- 5.1.1.2 Non-Alcoholic
- 5.1.1.2.1 Juices
- 5.1.1.2.2 Carbonated Drinks (CSDs)
- 5.1.1.2.3 Dairy Product Based Drinks
- 5.1.1.2.4 Other Non-Alcoholic Beverages
- 5.1.1.1 Alcoholic
- 5.1.2 Food (Jam, Jelly, Marmalades, Honey, Sausages and Condiments, Oil, Pickles)
- 5.1.3 Cosmetics and Personal Care
- 5.1.4 Pharmaceuticals (excluding Vials and Ampoules)
- 5.1.5 Perfumery
- 5.1.1 Beverages
- 5.2 By Color
- 5.2.1 Green
- 5.2.2 Amber
- 5.2.3 Flint
- 5.2.4 Other Colors
- 5.3 By Country
- 5.3.1 Egypt
- 5.3.2 Nigeria
- 5.3.3 Kenya
- 5.3.4 Morocco
- 5.3.5 South Africa
- 5.3.6 Rest of Africa
6 COMPETITIVE LANDSCAPE
- 6.1 Market Concentration
- 6.2 Strategic Moves and Developments
- 6.3 Company Market Share Analysis, (Based on Latest Production Capacity)
- 6.4 Company Profiles (includes Global Level Overview, Market Level Overview, Core Segments, Financials as available, Strategic Information, Market Rank/Share, Products and Services, Recent Developments)
- 6.4.1 Ardagh Group S.A.
- 6.4.2 Beta Glass PLC
- 6.4.3 Consol Glass Pty Ltd
- 6.4.4 O-I Glass, Inc.
- 6.4.5 Verallia Packaging S.A.S.
- 6.4.6 Isanti Glass 1 (Pty) Ltd
- 6.4.7 Kandil Glass
- 6.4.8 Middle East Glass Manufacturing Company S.A.E.
- 6.4.9 Saverglass SAS
- 6.4.10 African Glass Limited
- 6.4.11 The National Company for Glass and Crystal S.A.E.
- 6.4.12 Gerresheimer AG
- 6.4.13 Arab Pharmaceutical Glass Company S.A.E.
- 6.4.14 Dalgen Packaging CC
- 6.4.15 Nampak Limited
- 6.4.16 United Glass Containers Company (UGC)
- 6.4.17 Societe d'Exploitation de Verreries au Maroc (SEVAM)
7 MARKET OPPORTUNITIES AND FUTURE OUTLOOK
- 7.1 White-space and Unmet-Need Assessment