|
시장보고서
상품코드
2121976
유리병 및 용기 : 시장 점유율 분석, 업계 동향과 통계, 성장 예측(2026-2031년)Glass Bottles And Containers - Market Share Analysis, Industry Trends & Statistics, Growth Forecasts (2026 - 2031) |
||||||
 Mordor Intelligence
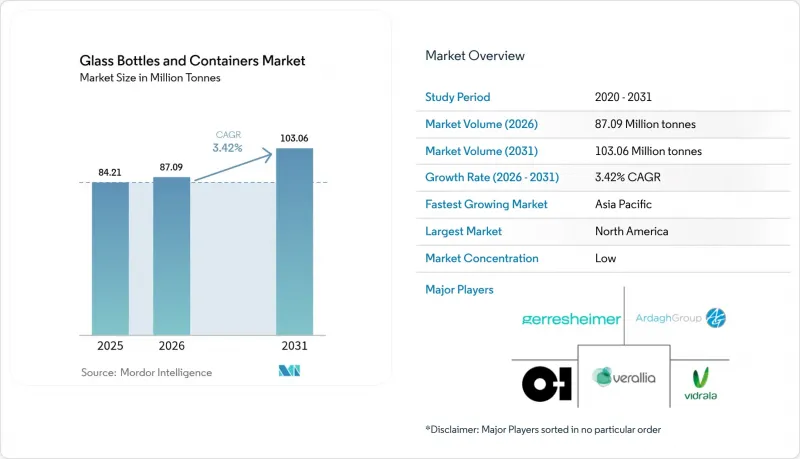
Mordor Intelligence에 따르면 유리병과 용기 시장 규모는 2025년 8,421만 톤에서 2026년에는 8,709만 톤으로 확대하며, 2026-2031년에 CAGR 3.42%로 추이하며, 2031년까지 1억 306만 톤에 달할 것으로 예측됩니다.
이 보고서는 최종사용자별(음료[주류(맥주, 와인, 증류주 등) 및 무알코올 음료(탄산음료(CSD), 유제품 기반 음료 등)], 식품[잼·젤리, 조미료·소스 등], 화장품·퍼스널 케어, 기타), 색상(플린트, 앰버, 그린, 기타) 및 지역별로 분류되어 있습니다. 시장 예측은 톤 단위로 표시되어 있습니다.
전 세계 유리병 및 용기 시장의 동향과 인사이트
플라스틱 사용 금지 조치가 재활용 가능한 유리 포장로의 전환을 촉진
캘리포니아주의 SB 54 법에 따라 2032년까지 일회용 플라스틱 포장을 65% 감축해야 할 의무가 부과되었으며, 프랑스에서는 2025년 1월부터 스티로폼 식품 용기가 금지됨에 따라 브랜드 소유주들은 유리로 전환해야 하는 압박을 받고 있습니다. 유럽연합(EU)에서 검토 중인 비스페놀 A 규제도 식품 접촉 분야에서의 전환을 더욱 촉진하고 있습니다. 유리는 무한한 폐쇄 순환을 유지하며 확립된 가정별 수거 체계가 갖춰져 있으며, 가공업체들은 설비 갱신 비용을 흡수하면서도 새로운 수요를 확보하고 있습니다. 이러한 파급 효과는 대형 소매점에서 음료 및 조미료 제품 라인이 유리 용기로 되돌아가고 있는 점에서도 분명하게 드러납니다. 유리 파편 공급은 일시적으로 부족하지만, 하이브리드 용광로 도입과 경량화를 통해 이익률 압박이 부분적으로 상쇄되어, 예측 기간 중 지속적인 수요 확대가 예상됩니다.
프레스티지 뷰티 시장의 ‘유리화’ 추세가 자(Jar) 및 병의 생산량을 끌어올리고 있습니다.
고급 스킨케어 및 향수 브랜드들은 프리미엄 품질과 환경에 대한 배려를 강조하기 위해 점점 더 유리를 채택하고 있습니다. 베라리아(Veralia)사의 100% 사용 후 소비자 재활용(PCR) 소재를 사용한 ‘Vista’ 병은 버진 원료로 생산하는 것에 비해 에너지 사용량을 40% 절감하여, 순환형 사회와 고급스러운 미학이 공존할 수 있음을 증명하고 있습니다. 엠보싱 가공, 컬러 그라데이션, 리필 가능한 디자인은 매장내 차별화를 강화하고, 더 높은 가격 책정을 정당화하고 있습니다. 미용 업계에서는 포장 비용이 소매 가격에서 차지하는 비중이 작기 때문에 브랜드는 대중 시장 음료에 비해 단위당 비용 상승을 더 쉽게 흡수할 수 있습니다. 이 추세는 전 세계에서 확산되고 있지만, 북미와 서유럽에서 특히 두드러지며, 맞춤형 금형 및 소량 생산에 대한 롱테일 수요를 지원하고 있습니다.
에너지 가격 변동이 용해로의 수익성을 위협
2024년, 영국의 전력 가격은 사상 최고 수준으로 급등하여 유리 제조업체들은 피크 시간대에는 생산 라인을 중단할 수밖에 없었습니다. 에너지 비용은 생산 비용의 약 18%를 차지하므로 가격 변동에 따라 시장 가격 조정이 반영되기 전에 이미 이익률이 떨어질 가능성이 있습니다. 탄소 가격 제도는 화석 연료 소비에 추가적인 페널티를 부과하므로 하이브리드 용광로나 부지내 재생 가능 에너지에 대한 자본 투자가 가속화되고 있습니다. 대조적으로, O-I Glass는 탈탄소화를 위해 1억 2,500만 달러의 연방 자금을 확보했으나, 소규모 지역 공장들은 자금 사정이 어려워져 단기적으로 공급이 위축될 가능성이 있습니다.
지역별 분석
북미는 2025년 용기용 유리 포장 시장의 55.18%를 차지했습니다. 이는 성숙한 가정 쓰레기 수거 제도와 높은 칼렛 혼합 비율을 장려하는 기업의 지속가능성 목표가 기여한 결과입니다. 글라스 패키징 인스티튜트(GPI)가 제시한 ‘2030년까지 재활용률 50% 달성’이라는 로드맵은 장기적인 원료 공급 기반을 지원하고 있습니다. 그러나 에너지 가격 변동과 고부가가치 음료 시장에서 rPET의 보급 확대가 판매량 증가를 억제하고 있으며, 전략적 초점은 프리미엄 증류주 및 미용 관리 제품으로 이동하고 있습니다.
유럽은 북미에 뒤처져 있지만, EU의 80.8%라는 재활용률의 혜택을 받고 있으며, 이를 통해 칼렛 확보와 용해로 에너지 수요 감축이 도모되고 있습니다. Ardagh사와 Verallia사는 생산량을 유지하면서 탄소 가격 변동 위험을 헤지하기 위해 전기 보조식 및 수소 대응 용융로에 대한 투자를 추진하고 있습니다. 그러나 전력 가격 급등과 환경세로 인해 단기적인 이익률이 압박을 받고 있으며, 재생 가능 에너지를 활용한 공유 마이크로그리드 및 국경을 초월한 칼렛 거래에 관한 협력이 활발해지고 있습니다.
아시아태평양은 가장 성장이 두드러지는 지역으로, 2031년까지 연평균 성장률(CAGR) 4.76%로 확대되며 용기용 유리 포장 시장에서의 격차를 빠르게 좁히고 있습니다. 인도와 중국에서는 무균 바이알이 필요한 의약품 공장의 신축이 진행되고 있는 반면, 한국과 일본에서는 고급 스킨케어 제품을 위한 프리미엄 화장품용 유리가 수입되고 있습니다. O-I Glass사가 콜롬비아 지파킬라에서 실시한 1억 2,000만 달러 규모의 설비 현대화는 각 제조사가 신흥 지역에서 최고 수준의 기술을 도입하고, ESG 요건을 준수하면서 수요를 확보하고자 하고 있음을 보여줍니다. 동남아시아 일부 지역에서는 칼렛 처리 인프라가 제한적이어서 재활용 원료의 사용이 제약받고 있으며, 이로 인해 유럽 및 미국의 동종 업계 경쟁사들에 비해 비용 면에서 불리한 상황에 처해 있습니다. 그럼에도 불구하고 소득 증가와 순환형 경제를 향한 규제 추진으로 인해 장기적으로는 견고한 수요가 예상됩니다.
기타 혜택:
- 엑셀 형식의 시장 예측(ME) 시트
- 3개월간의 애널리스트 지원
자주 묻는 질문
목차
제1장 서론
제2장 조사 방법
제3장 개요
제4장 시장 구도
제5장 시장 규모와 성장 예측
제6장 경쟁 구도
제7장 시장 기회와 향후 전망
KSA 26.09.04According to Mordor Intelligence, the glass bottles and Containers market size is expected to grow from 84.21 million tonnes in 2025 to 87.09 million tonnes in 2026 and is forecast to reach 103.06 million tonnes by 2031 at 3.42% CAGR over 2026-2031.

This report is Segmented by End-User (Beverages [Alcoholic {Beer, Wine, Spirits, and More}, and Non-Alcoholic {Carbonated Drinks (CSDs), Dairy Product Based Drinks, and More}], Food [Jam and Jelly, Condiments and Sauces, and More], Cosmetics and Personal Care, and More), Color (Flint, Amber, Green, and More) and Geography. The Market Forecasts are Provided in Terms of Volume (Tonnes).
Global Glass Bottles And Containers Market Trends and Insights
Plastic Bans Drive Shift to Recyclable Glass Packaging
California's SB 54 mandates a 65% cut in single-use plastic packaging by 2032, while France has barred expanded polystyrene food containers from January 2025, propelling brand owners to switch to glass. The European Union's pending bisphenol-A restrictions further reinforce conversion in food contact segments. Because glass maintains an endless closed loop and established curb-side collection, converters are capturing new volumes even as they absorb retooling costs. The ripple effect is evident in beverage and condiment lines moving back to glass at big-box retailers. Though cullet supply tightens temporarily, hybrid furnaces and lightweighting partially offset margin compression, paving a sustained uplift through the forecast horizon.
Prestige Beauty "Glassification" Trend Lifts Jar and Bottle Volumes
Luxury skincare and fragrance brands increasingly adopt glass to signal premium quality and environmental stewardship. Verallia's 100% post-consumer-recycled (PCR) Vista bottles cut energy use by 40% versus virgin production, proving that circularity can coexist with high-end aesthetics.Embossing, color gradations, and refillable designs amplify shelf differentiation and justify higher price points. Since packaging cost is a small share of retail value in beauty, brands absorb higher unit costs more easily than mass-market beverages. The trend scales globally but is most pronounced in North America and Western Europe, reinforcing long-tail demand for custom molds and short production runs.
Energy Price Volatility Threatens Furnace Economics
Electricity prices in the United Kingdom spiked to record levels in 2024, compelling glassmakers to idle lines during peak tariffs. Energy constitutes roughly 18% of production costs, so volatility can erase margins faster than price adjustments reach the market. Carbon-pricing schemes further penalize fossil-fuel consumption, intensifying capital commitments toward hybrid furnaces and on-site renewables. In contrast, O-I Glass secured USD 125 million in federal funding for decarbonization, but smaller regional plants face liquidity strains, potentially curbing short-term supply.
Other drivers and restraints analyzed in the detailed report include:
- Pharma Fill-Finish Expansion Boosts Demand for Glass Vials
- Craft Alcohol Boom Spurs Custom Glass Container Demand
- rPET Bottle Adoption Undercuts Glass in Logistics-Sensitive Channels
For complete list of drivers and restraints, kindly check the Table Of Contents.
Geography Analysis
North America captured 55.18% of the container glass packaging market in 2025, leveraging mature curbside collection and corporate sustainability goals that encourage high-cullet recipes. The Glass Packaging Institute's roadmap to reach a 50% recycling rate by 2030 underpins the long-term feedstock base. Yet energy-price swings and growing rPET penetration in value beverages temper volume gains, shifting strategic emphasis toward premium spirits and beauty care.
Europe trails but benefits from the EU's 80.8% recycling rate, which secures cullet and lowers furnace energy demand. Ardagh and Verallia are investing in electric-boost and hydrogen-ready furnaces to hedge carbon-pricing exposure while maintaining output. However, power-price stress and environmental levies suppress near-term margins, sparking collaboration on shared renewable micro-grids and cross-border cullet trade.
Asia Pacific is the fastest-growing region, expanding 4.76% CAGR through 2031 and rapidly closing the gap in the container glass packaging market. India and China build greenfield pharmaceutical plants that require sterile vials, while South Korea and Japan import premium cosmetic glass for luxury skincare. O-I Glass's USD 120 million upgrade in Zipaquira, Colombia, signals how producers replicate best-in-class technology in emerging regions to capture demand while aligning with ESG mandates. Limited cullet infrastructure in parts of Southeast Asia constrains recycled content, creating cost penalties versus Western peers; nevertheless, rising incomes and regulatory push for circularity promise robust long-term demand.
- O-I Glass, Inc.
- Verallia S.A.
- Ardagh Group S.A.
- Vidrala S.A.
- Vetropack Holding AG
- Gerresheimer AG
- SGD S.A.
- Stoelzle Oberglas GmbH
- Wiegand-Glas Holding GmbH
- Hindusthan National Glass & Industries Limited
- Piramal Glass Private Limited
- Nihon Yamamura Glass Co., Ltd.
- Sisecam
- Compagnie de Saint-Gobain S.A. (Packaging division)
- Heinz-Glas GmbH & Co. KGaA
- Vitro, S.A.B. de C.V.
- BA Glass B.V.
- Ciner Glass Holdings Limited
Additional Benefits:
- The market estimate (ME) sheet in Excel format
- 3 months of analyst support
TABLE OF CONTENTS
1 INTRODUCTION
- 1.1 Study Assumptions and Market Definition
- 1.2 Scope of the Study
2 RESEARCH METHODOLOGY
3 EXECUTIVE SUMMARY
4 MARKET LANDSCAPE
- 4.1 Market Overview
- 4.2 Market Drivers
- 4.2.1 Plastic Bans Drive Shift to Recyclable Glass Packaging
- 4.2.2 Prestige Beauty "Glassification" Trend Lifts Jar and Bottle Volumes
- 4.2.3 Pharma Fill-Finish Expansion Boosts Demand for Glass Vials
- 4.2.4 Craft Alcohol Boom Spurs Custom Glass Container Demand
- 4.2.5 FDI-Funded Hybrid Furnaces Expand Green Glass Capacity
- 4.2.6 ESG Compliance Spurs Shift to High-Cullet Glass for Export Markets
- 4.3 Market Restraints
- 4.3.1 Energy Price Volatility Threatens Furnace Economics
- 4.3.2 rPET Bottle Adoption Undercuts Glass in Logistics-Sensitive Channels
- 4.3.3 Weak Cullet Collection Infrastructure Limits Recycled Content
- 4.3.4 Breakage Losses in Long-Haul Shipping Discourage Glass Use
- 4.4 Industry Supply-Chain Analysis
- 4.5 Container Glass Furnace Capacity and Locations in Global
- 4.5.1 Plant Locations and Year of Commencement
- 4.5.2 Production Capacities
- 4.5.3 Types of Furnaces
- 4.5.4 Color of Glass Produced
- 4.6 Export-Import Data of Container Glass - Covering Key Import and Export Destinations
- 4.6.1 Import Volume and Value, 2021-2024
- 4.6.2 Export Volume and Value, 2021-2024
- 4.7 Porter's Five Forces Analysis
- 4.7.1 Threat of New Entrants
- 4.7.2 Bargaining Power of Suppliers
- 4.7.3 Bargaining Power of Buyers
- 4.7.4 Threat of Substitutes
- 4.7.5 Competitive Rivalry
- 4.8 Raw Material Analysis
- 4.9 Recycling Trends for Glass Packaging
- 4.10 Demand vs Supply Analysis for Glass Packaging
5 MARKET SIZE AND GROWTH FORECASTS (VOLUME)
- 5.1 By End-user
- 5.1.1 Beverages
- 5.1.1.1 Alcoholic
- 5.1.1.1.1 Beer
- 5.1.1.1.2 Wine
- 5.1.1.1.3 Spirits
- 5.1.1.1.4 Other Alcoholic Beverages (Cider and Other Fermented Drinks)
- 5.1.1.2 Non-Alcoholic
- 5.1.1.2.1 Juices
- 5.1.1.2.2 Carbonated Drinks (CSDs)
- 5.1.1.2.3 Dairy Product Based Drinks
- 5.1.1.2.4 Other Non-Alcoholic Beverages
- 5.1.1.1 Alcoholic
- 5.1.2 Food (Jam, Jelly, Marmalades, Honey, Sausages and Condiments, Oil, Pickles)
- 5.1.3 Cosmetics and Personal Care
- 5.1.4 Pharmaceuticals (excluding Vials and Ampoules)
- 5.1.5 Perfumery
- 5.1.1 Beverages
- 5.2 By Color
- 5.2.1 Green
- 5.2.2 Amber
- 5.2.3 Flint
- 5.2.4 Other Colors
- 5.3 By Geography
- 5.3.1 North America
- 5.3.1.1 United States
- 5.3.1.2 Canada
- 5.3.1.3 Mexico
- 5.3.2 South America
- 5.3.2.1 Brazil
- 5.3.2.2 Argentina
- 5.3.2.3 Rest of South America
- 5.3.3 Europe
- 5.3.3.1 United Kingdom
- 5.3.3.2 Germany
- 5.3.3.3 France
- 5.3.3.4 Italy
- 5.3.3.5 Spain
- 5.3.3.6 Russia
- 5.3.3.7 Rest of Europe
- 5.3.4 Asia Pacific
- 5.3.4.1 China
- 5.3.4.2 Japan
- 5.3.4.3 India
- 5.3.4.4 South Korea
- 5.3.4.5 Australia
- 5.3.4.6 Rest of Asia Pacific
- 5.3.5 Middle East and Africa
- 5.3.5.1 Middle East
- 5.3.5.1.1 United Arab Emirates
- 5.3.5.1.2 Saudi Arabia
- 5.3.5.1.3 Turkey
- 5.3.5.1.4 Rest of Middle East
- 5.3.5.2 Africa
- 5.3.5.2.1 South Africa
- 5.3.5.2.2 Nigeria
- 5.3.5.2.3 Rest of Africa
- 5.3.5.1 Middle East
- 5.3.1 North America
6 COMPETITIVE LANDSCAPE
- 6.1 Market Concentration
- 6.2 Strategic Moves and Developments
- 6.3 Company Market Share Analysis, (Based on Latest Production Capacity)
- 6.4 Company Profiles (includes Global level Overview, Market level overview, Core Segments, Financials as available, Strategic Information, Market Rank/Share for key companies, Products and Services, and Recent Developments)
- 6.4.1 O-I Glass, Inc.
- 6.4.2 Verallia S.A.
- 6.4.3 Ardagh Group S.A.
- 6.4.4 Vidrala S.A.
- 6.4.5 Vetropack Holding AG
- 6.4.6 Gerresheimer AG
- 6.4.7 SGD S.A.
- 6.4.8 Stoelzle Oberglas GmbH
- 6.4.9 Wiegand-Glas Holding GmbH
- 6.4.10 Hindusthan National Glass & Industries Limited
- 6.4.11 Piramal Glass Private Limited
- 6.4.12 Nihon Yamamura Glass Co., Ltd.
- 6.4.13 Sisecam
- 6.4.14 Compagnie de Saint-Gobain S.A. (Packaging division)
- 6.4.15 Heinz-Glas GmbH & Co. KGaA
- 6.4.16 Vitro, S.A.B. de C.V.
- 6.4.17 BA Glass B.V.
- 6.4.18 Ciner Glass Holdings Limited
7 MARKET OPPORTUNITIES AND FUTURE OUTLOOK
- 7.1 White-space and Unmet-Need Assessment