|
시장보고서
상품코드
2122921
컨테이너보드 시장 : 시장 점유율 분석, 업계 동향 및 통계, 성장 예측(2026-2031년)Containerboard - Market Share Analysis, Industry Trends & Statistics, Growth Forecasts (2026 - 2031) |
||||||
 Mordor Intelligence
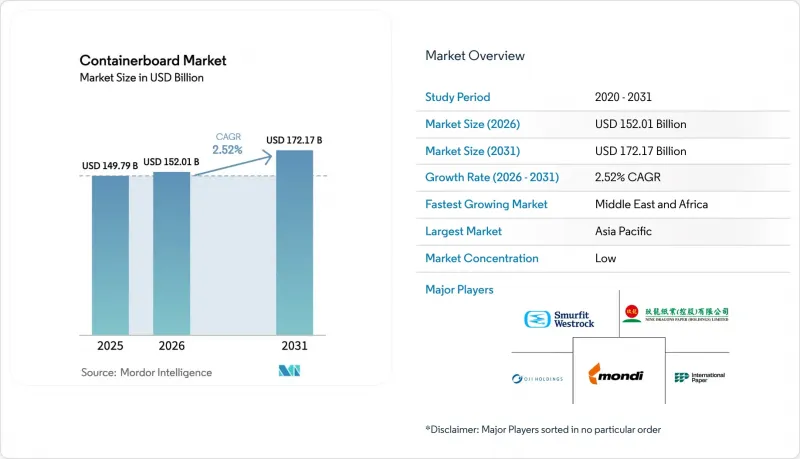
Mordor Intelligence에 의하면, 컨테이너보드 시장 규모는 2025년 1,497억 9,000만 달러로 평가되었고, 2026년에는 1,520억 1,000만 달러로 추정되고, 2026-2031년 CAGR 2.52%로 성장을 지속할 전망이며, 2031년까지 1,721억 7,000만 달러에 이를 것으로 예측됩니다.
본 보고서는 소재별(버진 섬유, 재생 섬유, 혼합 섬유), 유형별(크래프트 라이너, 테스트 라이너, 플루팅 등), 평량별(150 Gsm 미만, 150-300 Gsm, 300 Gsm 이상), 최종 사용자별(식품 및 음료, 소비재, 산업용, 기타) 및 지역별(북미, 유럽, 아시아태평양, 남미, 기타)로 분류되어 있습니다. 시장 전망은 금액(달러) 기준으로 제시되어 있습니다.
세계의 컨테이너보드 시장 동향 및 인사이트
전자상거래 배송량 증가
소포의 폭발적인 증가로 인해 자동 분류 및 라스트 마일 배송 과정에서 화물이 낙하나 압축으로 인한 높은 부하에 노출됨에 따라, 라이너 보드의 사양이 재검토되고 있습니다. 현재, 통합형 대기업들은 2,400만 톤의 컨테이너보드 생산 능력과 2,000곳 이상의 컨테이너보드 공장을 결합하여, 제품 치수에서 5mm 이내의 부피 활용률을 실현하는 온디맨드 방식의 생산을 가능하게 하고 있습니다. 그 결과, 파열 강도가 1,100 kPa를 초과하는 크라프트 라이너에 대한 수요가 증가하고 있습니다. 이 기준치는 재생 테스트 라이너가 버진 소재로 보강하지 않으면 종종 충족하지 못하는 수준입니다.
가공 식품 및 음료 포장 시장의 성장
아시아태평양과 남미에서 도시화가 진행 중인 중산층 소비자들은 컨테이너보드 케이스에 포장된 상온 보관 가능한 식품을 계속해서 선호하고 있습니다. 각 컨버터 업체들은 콜드체인 물류를 통해 판지의 강도를 유지하는 내습성 코팅 및 급속 냉각용 라이너로 이에 대응하고 있습니다. 이러한 수요 급증은 1회분 용량의 음료 멀티팩에서 가장 두드러지는데, 플루트 형상을 재설계하여 경량화를 도모하면서도 적층 강도를 유지하고 있기 때문에 소매업체는 팔레트 높이를 더 높게 설정할 수 있게 되었습니다.
폐지 가격 변동
2025년 어느 분기에는 사용 후 컨테이너보드 용기의 현물 가격이 16% 하락하여, 재생 섬유 제조업체의 이익률이 약 250 베이시스 포인트 축소되었습니다. 이러한 가격 변동으로 인해 독립 제조업체들은 수직 통합이나 장기 공급 계약으로의 전환을 강요받고 있습니다. 그렇지 않으면 분기별 섬유 원가가 20-30% 변동할 가능성이 있기 때문입니다. 이러한 추세는 수익성을 유지하는 데 있어 비용 관리 전략이 얼마나 중요한지를 여실히 보여줍니다.
부문별 분석
2025년, 재생 펄프는 시장 점유율의 58.32%를 차지했습니다. 이는 회수율이 90% 이상의 유럽 및 북미의 성숙한 회수 루프에 힘입은 결과입니다. 혼합 등급 컨테이너보드 원지 시장은 가공업체들이 비용과 파열 강도의 균형을 맞추는 가운데, 2031년까지 연평균 성장률(CAGR)이 3.43%로 다른 모든 카테고리를 웃도는 성장이 예상됩니다. 케미-열-기계 펄프와 크라프트 섬유를 결합한 다층 구조의 개념은 제지 제조업체가 낮은 평량으로 강성을 실현하기 위한 기술적 노력을 보여줍니다.
블렌드 배합을 통해 폐지 가격 변동에 실시간으로 대응할 수 있으므로, 현물 조달에 의존하는 제지 제조업체의 이익률 변동을 완화할 수 있습니다. 재생 섬유 함유율에 관한 규제상 최저 기준으로 인해 버진 펄프 생산자는 폐지 원료를 혼합할 수밖에 없게 되었으며, 이는 블렌드 채택을 더욱 가속화하고 있습니다. 용도 면에서 블렌드 라이너는 완전한 버진 펄프 구성을 필요로 하지 않으며, 내습성이 요구되는 신선 식품이나 수출용 컨테이너의 포장으로 점점 더 많이 사용되고 있습니다.
크래프트 라이너는 고화질이 요구되는 소매 및 전자상거래용 상자의 외부 라이너로 선호되며, 2025년에는 매출 점유율의 46.43%를 차지했습니다. 한편, 플루팅은 연평균 4.32%의 성장률이 예상되며, 이는 컨테이너보드 시장에서 가장 빠른 성장세입니다. 73 gsm의 경량 세미케미컬 플루팅이 80-85 gsm의 재활용 미디엄을 대체하여, 에지 크러시 값을 4.0 kN/m 이상으로 유지하면서 최대 16%의 자재 절감을 실현하고 있습니다.
플루팅 수요 증가는 각 컨버터 업체들이 C-플루트에서 판지 소비량을 줄이면서도 적재 성능을 유지할 수 있는 더 얇은 B-플루트 및 E-플루트 구조로 전환하고 있음을 반영합니다. 이에 대응하여 크라프트 라이너 제조업체들은 EC의 파열 강도 요건을 충족하고 운송 비용을 절감하는 72-92 gsm 등급의 제품을 출시함으로써, 컨테이너보드 시장의 고급 외장재 분야에서 우위를 공고히 하고 있습니다.
지역별 분석
아시아태평양은 중국의 1억 2,000만 톤 생산 능력을 기반으로 2025년 생산량의 40.32%를 차지했습니다. 그러나 중국 시장의 성숙화와 동남아시아로의 생산 거점 이전으로 인해 이 지역의 성장세는 완만해지고 있습니다. 인도, 베트남, 태국에서는 현지 브랜드 소유주를 대상으로 리드 타임을 45-60일에서 10일 미만으로 단축하는 그린필드 컨테이너보드 제조 설비가 도입되고 있습니다. 중국 북부와 인도 일부 지역의 물 부족을 배경으로, 폐쇄형 폐수 처리 시스템 및 연안 해수 담수화 시설 연결을 위한 투자가 진행되고 있습니다.
중동 및 아프리카는 사우디아라비아의 ‘비전 2030’에 따른 인프라 구축과 이집트의 산업 다각화에 힘입어, 2031년까지 연평균 성장률(CAGR) 4.76%를 기록하며 가장 빠르게 성장하는 지역 블록을 형성하고 있습니다. 사우디아라비아의 45만 톤 생산 능력 증설은 국내의 저가 가스와 항만과의 근접성을 활용하여 지역 전체공급 확대에 기여하고 있습니다. 사하라 이남 아프리카 수요는 수거 네트워크의 취약성으로 인해 제약을 받고 있으며, 국내 순환 시스템이 정비될 때까지는 남미나 유럽에서 버진 섬유를 수입해야 합니다.
유럽과 북미에서는 고비용 제지 공장의 합리화가 진행되는 한편, 통합형 공장에서는 바이오매스를 이용한 열병합 발전 도입이 추진되고 있습니다. 미국에서는 2개의 제지 공장이 폐쇄되어 총 25만 톤의 생산 능력이 감축되었으나, 인수를 통한 재생지 생산 능력 확충이 이 감축분을 상쇄했습니다. 유럽에서는 재생지 함유율에 대한 최저 기준으로 인해 각 제지사들이 경량이며 재생률이 높은 등급으로의 전환을 강요받고 있지만, 산업 생산의 침체로 인해 총 생산량 증가세는 소폭에 그치고 있습니다.
남미에서는 브라질의 수직 통합형 임업 자산이 계속해서 호재로 작용하고 있습니다. 이러한 자산들은 도시화와 식료품의 신속한 배송에 따른 식품 및 음료용 케이스용 컨테이너보드를 공급하고 있습니다. 환율 변동이 수출 경쟁력에 계속 영향을 미치고 있지만, 내수 수요는 견조한 모습을 유지하고 있습니다.
기타 혜택 :
- 엑셀 형식 시장 예측(ME) 시트
- 3개월간의 애널리스트 지원
자주 묻는 질문
목차
제1장 서론
제2장 조사 방법
제3장 주요 요약
제4장 시장 구도
제5장 시장 규모 및 성장 예측
제6장 경쟁 구도
제7장 시장 기회 및 향후 전망
AJY 26.09.07According to Mordor Intelligence, the containerboard market size is expected to grow from USD 149.79 billion in 2025 to USD 152.01 billion in 2026 and is forecast to reach USD 172.17 billion by 2031 at a 2.52% CAGR over 2026-2031.
This report is Segmented by Material (Virgin Fibers, Recycled Fibers, and Blended Fibers), Type (Kraftliners, Testliners, Flutings, and More), Basis Weight (Below 150 Gsm, 150-300 Gsm, and Above 300 Gsm), End User (Food and Beverage, Consumer Goods, Industrial, and More), and Geography (North America, Europe, Asia-Pacific, South America, and More ). The Market Forecasts are Provided in Terms of Value (USD).
Global Containerboard Market Trends and Insights
Rising E-commerce Shipping Volumes
Explosive parcel growth is reshaping linerboard specifications as automated sortation and last-mile fulfillment subject shippers to higher drop and compression stresses. Integrated majors now combine 24 million tons of containerboard capacity with more than 2,000 box plants, enabling on-demand formats that achieve cube utilization within 5 millimeters of product dimensions. The result is elevated demand for kraftliners delivering burst strength above 1,100 kPa, a threshold that recycled testliners often miss without virgin reinforcement.
Growth in Processed Food and Beverage Packaging
Urbanizing middle-class consumers in Asia-Pacific and South America continue to favor shelf-stable foods packed in corrugated cases. Converters respond with moisture-resistant coatings and rapid-cooling liners that maintain board integrity through cold-chain logistics. The surge is most visible in single-serve beverage multipacks, where redesigned flute profiles cut weight yet uphold stacking strength, allowing retailers to run higher pallet heights.
Volatility in Recovered Paper Prices
Spot prices for old corrugated containers fell 16% in one quarter of 2025, compressing recycled-fiber mill margins by roughly 250 basis points. Such swings push independent producers toward vertical integration or long-term supply contracts, as quarterly fiber costs can otherwise fluctuate 20-30%. This trend highlights the importance of cost management strategies in maintaining profitability.
Other drivers and restraints analyzed in the detailed report include:
- Shift Toward Sustainable and Recyclable Packaging Solutions
- Lightweight Containerboard Innovations Reducing Shipping Costs
- Availability of Alternative Flexible Packaging Solutions
For complete list of drivers and restraints, kindly check the Table Of Contents.
Segment Analysis
Recycled fibers represented 58.32% of market share in 2025, anchored by mature collection loops in Europe and North America, where recovery rates exceed 90%. The containerboard market for blended grades is projected to outpace all others, with a 3.43% CAGR through 2031, as converters balance cost with burst strength. A multilayer concept pairing chemithermomechanical pulp with kraft fibers showcases how mills are engineering stiffness at lower grammages.
Blended formulations allow real-time adjustment to price shifts in recovered paper, smoothing margin swings for mills exposed to spot procurement. Regulatory minimums on recycled content compel virgin-fiber producers to integrate recovered furnish, further accelerating blend adoption. In application terms, blended liners increasingly ship fresh produce and export containers that require moisture resistance without full virgin composition.
Kraftliners held a 46.43% revenue share in 2025 as the favored outer liner for high-graphics retail and e-commerce cartons. Flutings, however, are forecast to grow 4.32% annually, the swiftest pace in the containerboard market. Lightweight semi-chemical flutings at 73 gsm are replacing 80-85 gsm recycled mediums, saving up to 16% material while keeping edge-crush values above 4.0 kN/m.
The uplift in fluting demand mirrors converter migration from C-flute to thinner B- and E-flute structures that trim board consumption yet uphold stacking performance. Kraftliner producers counter by launching 72-92 gsm grades that satisfy e-commerce burst requirements and reduce freight costs, reinforcing their dominance in premium outer facings of the containerboard market.
Complete Report Scope:
- By Material
- Virgin Fibers
- Recycled Fibers
- Blended Fibers
- By Type
- Kraftliners
- Testliners
- Flutings
- Other Types
- By Basis Weight
- Below 150 gsm
- 150 - 300 gsm
- Above 300 gsm
- By End User
- Food and Beverage
- Consumer Goods
- Industrial
- Other End Users
- By Geography
- North America
- United States
- Canada
- Mexico
- Europe
- Germany
- France
- United Kingdom
- Italy
- Spain
- Rest of Europe
- Asia-Pacific
- China
- Japan
- India
- South Korea
- Australia and New Zealand
- Rest of Asia-Pacific
- South America
- Brazil
- Argentina
- Rest of South America
- Middle East
- Saudi Arabia
- United Arab Emirates
- Turkey
- Rest of Middle East
- Africa
- South Africa
- Egypt
- Nigeria
- Rest of Africa
- North America
Geography Analysis
Asia-Pacific controlled 40.32% of 2025 output, anchored by China's 120 million-ton capacity. Nevertheless, maturation in China and relocations to Southeast Asia are moderating regional growth. India, Vietnam, and Thailand draw greenfield corrugators that cut lead times from 45-60 days to under 10 days for local brand owners. Water scarcity in northern China and parts of India is prompting investment in closed-loop effluent systems or coastal desalination tie-ins.
The Middle East and Africa comprise the fastest-growing bloc at 4.76% CAGR through 2031, propelled by Saudi Vision 2030 infrastructure and Egypt's industrial diversification. A 450,000-ton capacity increment in Saudi Arabia leverages low domestic gas prices and port proximity to broaden regional supply. Sub-Saharan demand is constrained by weak collection networks, necessitating virgin fiber imports from South America and Europe until domestic loops mature.
Europe and North America are rationalizing high-cost mills while upgrading integrated sites with biomass cogeneration. Two mill closures in the United States removed a combined 250,000 tons, but recycled capacity additions via acquisitions offset the cuts. In Europe, minimum recycled-content rules are nudging mills toward lighter, higher-recovered grades, though subdued industrial output keeps overall tonnage growth modest.
South America remains buoyed by Brazil's vertically integrated forestry assets that supply containerboard for food and beverage cases linked to urbanization and rapid grocery delivery. Currency volatility continues to influence export competitiveness, but local demand remains resilient.
- International Paper Company
- Smurfit WestRock
- Nine Dragons Paper Holdings
- Mondi plc
- Oji Holdings Corporation
- Cascades Inc.
- Stora Enso Oyj
- Sappi Limited
- Georgia-Pacific LLC
- Svenska Cellulosa Aktiebolaget SCA
- Lee and Man Paper Manufacturing
- Pratt Industries
- Klabin SA
- Rengo Co., Ltd.
- Packaging Corporation of America
- Asia Pulp and Paper (APP)
- Shanying International
- Visy Industries
Additional Benefits:
- The market estimate (ME) sheet in Excel format
- 3 months of analyst support
TABLE OF CONTENTS
1 INTRODUCTION
- 1.1 Study Assumptions and Market Definition
- 1.2 Scope of the Study
2 RESEARCH METHODOLOGY
3 EXECUTIVE SUMMARY
4 MARKET LANDSCAPE
- 4.1 Market Overview
- 4.2 Market Drivers
- 4.2.1 Rising E-commerce Shipping Volumes
- 4.2.2 Growth in Processed Food and Beverage Packaging
- 4.2.3 Shift Toward Sustainable and Recyclable Packaging Solutions
- 4.2.4 Expansion of Corrugated Box Plants in Emerging Markets
- 4.2.5 Lightweight Containerboard Innovations Reducing Shipping Costs
- 4.2.6 Increase in Intercontinental Trade Requiring Durable Packaging
- 4.3 Market Restraints
- 4.3.1 Availability of Alternative Flexible Packaging Solutions
- 4.3.2 Volatility in Recovered Paper Prices
- 4.3.3 Escalating Energy and Carbon Compliance Costs
- 4.3.4 Water Scarcity Constraints on Mill Operations
- 4.4 Industry Value Chain Analysis
- 4.5 Impact of Macroeconomic Factors on the Market
- 4.6 Regulatory Landscape
- 4.7 Technological Outlook
- 4.8 Porter's Five Forces Analysis
- 4.8.1 Bargaining Power of Suppliers
- 4.8.2 Bargaining Power of Consumers
- 4.8.3 Threat of New Entrants
- 4.8.4 Intensity of Competitive Rivalry
- 4.8.5 Threat of Substitutes
- 4.9 Investment Analysis
5 MARKET SIZE AND GROWTH FORECASTS(VALUE)
- 5.1 By Material
- 5.1.1 Virgin Fibers
- 5.1.2 Recycled Fibers
- 5.1.3 Blended Fibers
- 5.2 By Type
- 5.2.1 Kraftliners
- 5.2.2 Testliners
- 5.2.3 Flutings
- 5.2.4 Other Types
- 5.3 By Basis Weight
- 5.3.1 Below 150 gsm
- 5.3.2 150 - 300 gsm
- 5.3.3 Above 300 gsm
- 5.4 By End User
- 5.4.1 Food and Beverage
- 5.4.2 Consumer Goods
- 5.4.3 Industrial
- 5.4.4 Other End Users
- 5.5 By Geography
- 5.5.1 North America
- 5.5.1.1 United States
- 5.5.1.2 Canada
- 5.5.1.3 Mexico
- 5.5.2 Europe
- 5.5.2.1 Germany
- 5.5.2.2 France
- 5.5.2.3 United Kingdom
- 5.5.2.4 Italy
- 5.5.2.5 Spain
- 5.5.2.6 Rest of Europe
- 5.5.3 Asia-Pacific
- 5.5.3.1 China
- 5.5.3.2 Japan
- 5.5.3.3 India
- 5.5.3.4 South Korea
- 5.5.3.5 Australia and New Zealand
- 5.5.3.6 Rest of Asia-Pacific
- 5.5.4 South America
- 5.5.4.1 Brazil
- 5.5.4.2 Argentina
- 5.5.4.3 Rest of South America
- 5.5.5 Middle East
- 5.5.5.1 Saudi Arabia
- 5.5.5.2 United Arab Emirates
- 5.5.5.3 Turkey
- 5.5.5.4 Rest of Middle East
- 5.5.6 Africa
- 5.5.6.1 South Africa
- 5.5.6.2 Egypt
- 5.5.6.3 Nigeria
- 5.5.6.4 Rest of Africa
- 5.5.1 North America
6 COMPETITIVE LANDSCAPE
- 6.1 Market Concentration
- 6.2 Strategic Moves
- 6.3 Market Share Analysis
- 6.4 Company Profiles (Includes Global Level Overview, Market Level Overview, Core Segments, Financials as Available, Strategic Information, Market Rank/Share, Products and Services, and Recent Developments)
- 6.4.1 International Paper Company
- 6.4.2 Smurfit WestRock
- 6.4.3 Nine Dragons Paper Holdings
- 6.4.4 Mondi plc
- 6.4.5 Oji Holdings Corporation
- 6.4.6 Cascades Inc.
- 6.4.7 Stora Enso Oyj
- 6.4.8 Sappi Limited
- 6.4.9 Georgia-Pacific LLC
- 6.4.10 Svenska Cellulosa Aktiebolaget SCA
- 6.4.11 Lee and Man Paper Manufacturing
- 6.4.12 Pratt Industries
- 6.4.13 Klabin SA
- 6.4.14 Rengo Co., Ltd.
- 6.4.15 Packaging Corporation of America
- 6.4.16 Asia Pulp and Paper (APP)
- 6.4.17 Shanying International
- 6.4.18 Visy Industries
7 MARKET OPPORTUNITIES AND FUTURE OUTLOOK
- 7.1 White-space and Unmet-Need Assessment