
|
시장보고서
상품코드
2064445
싱가포르의 컨테이너보드 : 시장 점유율 분석, 업계 동향 및 통계, 성장 예측(2026-2031년)Singapore Containerboard - Market Share Analysis, Industry Trends & Statistics, Growth Forecasts (2026 - 2031) |
||||||
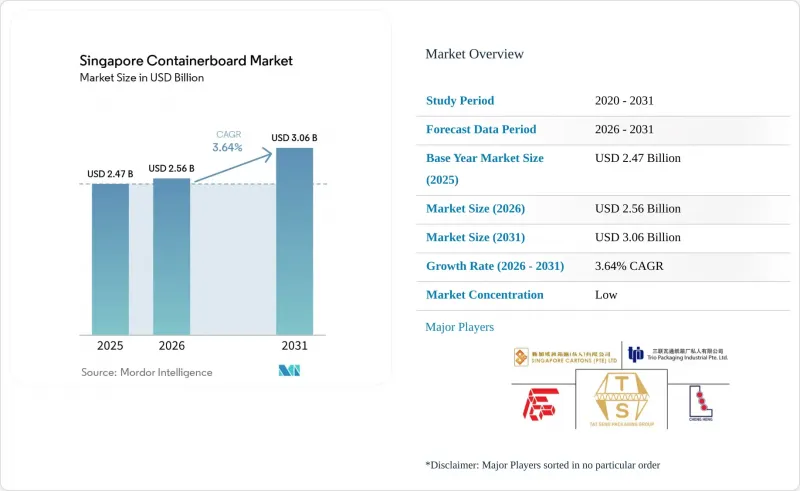
Mordor Intelligence에 의하면, 싱가포르의 컨테이너보드 시장 규모는 2025년에 24억 7,000만 달러로 평가되었습니다. 2026년 25억 6,000만 달러에서 2031년까지 30억 6,000만 달러에 이를 것으로 예상되며, 예측 기간(2026-2031년) CAGR은 3.64%를 나타낼 전망입니다.

본 보고서는 원료(버진 섬유 및 재생 섬유), 제품 유형(크래프트 라이너, 테스트 라이너, 플루팅), 그리고 최종 사용자 산업(식품 및 음료, 소비재, 산업용 등)별로 분류되어 있습니다. 시장 전망은 금액(달러) 기준으로 제시되어 있습니다.
싱가포르의 컨테이너보드 시장 동향 및 인사이트
전자상거래 주문 처리 및 라스트 마일 소포 시장의 성장
싱가포르의 컨테이너보드 시장은 소포 밀도 증가에 힘입어 성장하고 있습니다. 이는 포장 수요가 온라인 판매 총액뿐만 아니라 출하량, 처리 빈도, 배송 속도에도 영향을 받기 때문입니다. 2025년 3월, SingPost는 2026년 중반까지 지역 전자상거래 물류 허브의 소량 소포 처리 능력을 하루 10만 개에서 30만 개로 확대하기 위해 3,000만 싱가포르 달러(2,220만 달러)를 투자했습니다. 이 투자는 물류 사업자들이 단순한 단기적인 계절적 성수기뿐만 아니라, 소포 물량의 지속적인 성장을 염두에 두고 계획을 수립하고 있음을 보여줍니다. 전자기기, 화장품, 건강 관련 상품 등의 카테고리에서 이루어지는 크로스보더 B2C 배송은 순수한 국내 배송보다 더 많은 취급 거점을 거치기 때문에 골판지로 만든 운송용 포장재에 의존하는 경향이 있습니다. 이러한 추세는 싱가포르의 컨테이너보드 시장에서 물류 업체, 지역 풀필먼트 프로그램, 소량 전자상거래 포장 수요를 충족시키는 컨버터들의 재주문을 뒷받침하고 있습니다. 또한, 소포 중심 수요는 기존의 소매 보충 수요보다 변동이 심하기 때문에 변화하는 주문 패턴에 신속하게 대응할 수 있는 공급업체에게도 유리하게 작용합니다.
재활용 가능한 섬유 포장을 장려하는 지속가능성 규제
싱가포르의 컨테이너보드 시장은 재활용이 가능하고 추적 가능한 포장 방식의 가치를 꾸준히 높여주는 규제 체계의 혜택도 받고 있습니다. 2019년 자원 지속가능성법에 따라 시행되고 있는 NEA(국가환경청)의 ‘포장 보고 의무 제도’에서는 포장 상품을 공급하는 연간 매출액이 1,000만 싱가포르 달러(740만 달러) 이상인 기업에 대해 연례 포장 데이터 및 3R 계획의 제출을 의무화하고 있습니다. 이 제도는 재활용 원료의 사용 경로, 회수 가능성 및 규정 준수 목적을 위해 명확한 문서화를 제시할 수 있는 포장재의 선택을 장려하는 것입니다. 그 후, 싱가포르는 2026년 4월 1일부터 ‘음료 용기 반환 제도’를 시행하여 1,070대 이상의 자동 회수기를 설치하는 한편, 대상인 플라스틱 및 금속 음료 용기에 대해 0.10 싱가포르 달러(0.07 달러)의 환불 가능한 보증금을 도입했습니다. 이 제도는 음료 용기에 초점을 맞추고 있지만, 그럼에도 불구하고 포장 디자인, 표시 및 생산자의 책임에 관한 전반적인 준수 기준을 높이고 있습니다. 장기적으로 볼 때, 이러한 정책 방향은 혼합 소재 형태보다 재활용 시스템에 더 적합한 섬유계 포장 형태를 장려함으로써 싱가포르의 컨테이너보드 시장의 사업 환경을 강화하게 될 것입니다.
수입 펄프 및 판지의 원가 변동
싱가포르의 컨테이너보드 시장은 현지 가공업체들이 재생 섬유와 완제품 컨테이너보드를 전적으로 수입에 의존하고 있기 때문에 여전히 원자재 가격 변동 위험에 노출되어 있습니다. 동남아시아로 수입되는 미국산 OCC 11은 2025년 1월 톤당 175-180달러를 기록하며, 전년 동기 대비 20.2% 하락했습니다. 같은 기간, 유럽산 OCC 95/5는 톤당 145-150달러로 평가되고 있으며, 이는 폐지 가격 하락이 국지적인 현상이 아니라 광범위하게 확산되고 있음을 시사하고 있습니다. 그러나 폐지 가격의 하락이 반드시 가공업체의 이익률을 보장하는 것은 아닙니다. 왜냐하면, 같은 기간 동안 완제품 판지의 가격이나 운송비가 급격히 변동할 가능성이 있기 때문입니다. Fastmarkets의 보고서에 따르면, 2024년 중반에는 아시아 지역 내 컨테이너 운임이 일부 항로에서 3배로 급등했으며, 미국에서 동남아시아로 향하는 항로에서도 운임이 대폭 상승한 것으로 나타났습니다. 따라서 장기 계약이나 여러 산지에서 물량을 조달하는 체계를 갖추지 못한 컨버터는 입고 비용의 변동 폭이 더 커지게 되어, 싱가포르 컨테이너보드 시장 전체의 가격 안정성을 저해하는 요인이 되고 있습니다.
부문별 분석
2025년, 재생 섬유는 싱가포르의 컨테이너보드 시장 점유율의 65.14%를 차지하며, 일반 골판지 용도에서 재료 구성의 핵심적인 위치를 확고히 다졌습니다. 현지 가공업체는 말레이시아, 한국, 중국의 제지 제조업체들과 오랜 기간에 걸쳐 조달 관계를 구축해 왔으며, 이러한 협력 관계는 비용 효율성을 중시하는 상자 제조 프로그램을 위한 재생 테스트라이너 및 플루팅공급을 지속적으로 뒷받침하고 있습니다. 일상적인 수요 기반은 식품 유통, 산업용 포장 및 국내 소비재 운송에 있으며, 이러한 분야에서는 가공업체들이 고급스러운 마감보다는 안정적인 공급과 합리적인 가격을 우선시하고 있습니다. 또한, NEA(환경청)의 포장 보고 규정 역시 포장 신청서나 감축 계획에 명확히 기록할 수 있는 소재의 가치를 뒷받침하고 있습니다. 이러한 요인들이 복합적으로 작용함에 따라, 재생 등급은 가격 주기에 대한 일시적인 대응책으로만 여겨지는 것이 아니라, 싱가포르의 컨테이너보드 시장에서 구조적으로 중요한 위치를 계속 차지하고 있습니다.
버진 섬유는 2026년부터 2031년까지 연평균 성장률(CAGR) 3.98%를 나타낼 것으로 예측되며, 싱가포르의 컨테이너보드 시장에서 가장 빠르게 성장하는 소재 부문이 될 전망입니다. 이러한 수요는 반도체, 항공우주 정비, 제약 업계의 수출업체들에서 비롯된 것으로, 이들 기업은 규제가 엄격한 운송 환경에서 파열 강도, 더 선명한 인쇄, 그리고 뛰어난 균일성을 확보하기 위해 크라프트 라이너 표면 처리 보드가 필요합니다. 싱가포르의 수출 지향형 제조업의 특성이 이러한 변화를 뒷받침하고 있습니다. 고부가가치 제품의 경우, 일반적인 재생 보드로는 반드시 충족시킬 수 없는 포장 성능이 요구되는 경우가 많기 때문입니다. 마이크론이 싱가포르에 건설한 70억 달러 규모의 첨단 패키징 시설은 장기적으로 프리미엄 보드 수요를 뒷받침할 수 있는 고객층의 대표적인 사례라고 할 수 있습니다. 그 결과, 싱가포르의 컨테이너보드 업계에서는 양극화가 진행되고 있으며, 재생 등급이 대량 판매 수요를 담당하는 한편, 버진 등급은 수출 지향적인 용도에서 선택적으로 확대되고 있습니다.
기타 혜택 :
- 엑셀 형식 시장 예측(ME) 시트
- 3개월간의 애널리스트 지원
자주 묻는 질문
목차
제1장 서론
제2장 조사 방법
제3장 주요 요약
제4장 시장 구도
제5장 시장 규모 및 성장 예측
제6장 경쟁 구도
제7장 시장 기회 및 향후 전망
KTH 26.06.24According to Mordor Intelligence, the singapore containerboard market size was valued at USD 2.47 billion in 2025 and estimated to grow from USD 2.56 billion in 2026 to reach USD 3.06 billion by 2031, at a CAGR of 3.64% during the forecast period (2026-2031).
This report is Segmented by Material (Virgin Fibers, and Recycled Fibers), Product Type (Kraftliners, Testliners, and Flutings), and End-User Industry (Food and Beverage, Consumer Goods, Industrial, and More). The Market Forecasts are Provided in Terms of Value (USD).
Singapore Containerboard Market Trends and Insights
E-Commerce Fulfillment And Last-Mile Parcel Growth
The Singapore containerboard market is supported by rising parcel density because packaging demand responds to shipment counts, handling frequency, and delivery speed as much as to headline online sales values. In March 2025, SingPost committed SGD 30 million (USD 22.2 million) to expand small-parcel processing capacity at its Regional eCommerce Logistics Hub from 100,000 to 300,000 parcels per day by mid-2026. That investment showed that logistics operators were planning for sustained parcel growth rather than only for short seasonal peaks. Cross-border B2C shipments in categories such as electronics, cosmetics, and health-related goods tend to rely on corrugated transport packaging because they move through more handling points than purely domestic deliveries. This pattern supports repeat ordering from converters that serve logistics providers, regional fulfillment programs, and short-run e-commerce packaging needs across the Singapore containerboard market. It also favors suppliers that can respond quickly to changing order profiles, because parcel-led demand is more dynamic than conventional retail replenishment.
Sustainability Regulations Favoring Recyclable Fiber Packaging
The Singapore containerboard market is also benefiting from a regulatory framework that steadily increases the value of recyclable and traceable packaging formats. NEA's Mandatory Packaging Reporting framework, in force under the Resource Sustainability Act 2019, requires companies with annual turnover above SGD 10 million (USD 7.4 million) that supply packaged goods to submit annual packaging data and 3R plans. That system rewards packaging choices that can show recycled-content pathways, recovery potential, and clearer documentation for compliance purposes. Singapore then launched the Beverage Container Return Scheme on April 1, 2026, with more than 1,070 reverse vending machines and a SGD 0.10 (USD 0.07) refundable deposit on eligible plastic and metal beverage containers. The scheme is focused on beverage containers, yet it still raises the overall compliance baseline for packaging design, labeling, and producer accountability. Over time, that policy direction supports fiber-based packaging formats that fit recycling systems more easily than mixed-material formats, which strengthens the operating backdrop for the Singapore containerboard market.
Imported Fiber And Board Cost Volatility
The Singapore containerboard market remains exposed to input volatility because local converters depend entirely on imported recovered fiber and finished containerboard. US OCC 11 imported into Southeast Asia stood at USD 175-180 per tonne in January 2025, down 20.2% year over year. European OCC 95/5 was assessed at USD 145-150 per tonne during the same period, indicating that lower recovered paper prices were widespread rather than isolated. Lower fiber prices do not always protect converter margins because finished board prices and freight costs can move sharply over the same period. Fastmarkets reported that intra-Asia container shipping rates tripled on some route pairs in mid-2024, and routes from the United States to Southeast Asia also saw steep increases. Converters that lack long-term contracts or multi-origin sourcing, therefore, face sharper landed-cost swings, which limit pricing stability across the Singapore containerboard market.
Other drivers and restraints analyzed in the detailed report include:
- Export-Oriented Advanced Manufacturing Demand
- Food Delivery And Processed Food Shipment Growth
- Competition From Flexible And Reusable Packaging Formats
For complete list of drivers and restraints, kindly check the Table Of Contents.
Segment Analysis
Recycled fibers held 65.14% of the Singapore containerboard market share in 2025, which kept them firmly at the center of the material mix for standard corrugated applications. Local converters have built long-running procurement relationships with mills in Malaysia, South Korea, and China, and those links continue to support recycled testliner and fluting supply for cost-sensitive box programs. The everyday demand base comes from food distribution, industrial packaging, and domestic consumer-goods movement, where converters prioritize consistent supply and workable price points over premium finish. NEA's packaging reporting rules also reinforce the value of materials that can be documented clearly in packaging submissions and reduction plans. That combination keeps recycled grades structurally important to the Singapore containerboard market rather than treating them as a temporary response to pricing cycles.
Virgin fibers are projected to grow at a 3.98% CAGR from 2026 to 2031, making them the fastest-growing material segment within the Singapore containerboard market. Demand is tied to exporters in semiconductors, aerospace maintenance, and pharmaceuticals that need kraftliner-faced board for burst strength, cleaner printing, and better consistency in regulated shipping environments. Singapore's export manufacturing profile supports that shift because high-value goods often require packaging performance that standard recycled board does not always provide. Micron's new USD 7 billion advanced packaging facility in Singapore gives a clear example of the type of customer base that can sustain premium board demand over time. The result is a split structure in the Singapore containerboard industry, with recycled grades carrying volume demand and virgin grades expanding selectively in export-focused applications.
List of Companies Covered in this Report:
- Tat Seng Packaging Group Ltd.
- Far East Packaging Industrial Pte Ltd.
- Trio Packaging Industrial Pte Ltd.
- Cheng Heng Paper Products Co (Pte) Ltd.
- Singapore Cartons Pte Ltd.
- Interpak Industries Pte Ltd.
- Union Containers (Pte) Limited
- Stanpack Industries Pte Ltd.
- Federal Packaging Industries Pte Ltd.
- Hi-Rise Paper Products Pte. Ltd.
- Apac Packaging Pte Ltd.
- Asia Enviropak Pte. Ltd.
- Sankawa Packaging (S) Pte Ltd.
- Atlas Paper Products Pte Ltd.
- Advance Carton Pte Ltd.
- Paper Carpenter Pte. Ltd.
- Nippon Kompo Shizai Singapore Pte Ltd.
- Acepac International (S) Pte Ltd.
- AMB Packaging Pte Ltd.
Additional Benefits:
- The market estimate (ME) sheet in Excel format
- 3 months of analyst support
TABLE OF CONTENTS
1 INTRODUCTION
- 1.1 Study Assumptions and Market Definition
- 1.2 Scope of the Study
2 RESEARCH METHODOLOGY
3 EXECUTIVE SUMMARY
4 MARKET LANDSCAPE
- 4.1 Market Overview
- 4.2 Market Drivers
- 4.2.1 E-Commerce Fulfillment and Last-Mile Parcel Growth
- 4.2.2 Sustainability Regulations Favoring Recyclable Fiber Packaging
- 4.2.3 Export-Oriented Advanced Manufacturing Demand
- 4.2.4 Food Delivery and Processed Food Shipment Growth
- 4.2.5 Sustainable E-Commerce Packaging Guidelines Encouraging Right-Sized Corrugated Designs
- 4.2.6 Record Port Throughput Supporting Re-Export Packaging Demand
- 4.3 Market Restraints
- 4.3.1 Imported Fiber and Board Cost Volatility
- 4.3.2 Competition From Flexible and Reusable Packaging Formats
- 4.3.3 Weak Domestic Paper Recycling Economics
- 4.3.4 Packaging Reporting Rules Incentivizing Material Reduction
- 4.4 Impact of Macroeconomic Factors on the Market
- 4.5 Industry Value Chain Analysis
- 4.6 Trade and Import Dependence Analysis
- 4.7 Regulatory Landscape
- 4.8 Technological Outlook
- 4.9 Porter's Five Forces Analysis
- 4.9.1 Threat of New Entrants
- 4.9.2 Bargaining Power of Suppliers
- 4.9.3 Bargaining Power of Buyers
- 4.9.4 Threat of Substitutes
- 4.9.5 Intensity of Competitive Rivalry
5 MARKET SIZE AND GROWTH FORECASTS (VALUE)
- 5.1 By Material
- 5.1.1 Virgin Fibers
- 5.1.2 Recycled Fibers
- 5.2 By Product Type
- 5.2.1 Kraftliners
- 5.2.2 Testliners
- 5.2.3 Flutings
- 5.3 By End-User Industry
- 5.3.1 Food and Beverage
- 5.3.2 Consumer Goods
- 5.3.3 Industrial
- 5.3.4 Other End-User Industries
6 COMPETITIVE LANDSCAPE
- 6.1 Market Concentration
- 6.2 Strategic Moves
- 6.3 Market Share Analysis
- 6.4 Company Profiles (includes Global Level Overview, Market Level Overview, Core Segments, Financials as available, Strategic Information, Market Rank/Share, Products and Services, Recent Developments)
- 6.4.1 Tat Seng Packaging Group Ltd.
- 6.4.2 Far East Packaging Industrial Pte Ltd.
- 6.4.3 Trio Packaging Industrial Pte Ltd.
- 6.4.4 Cheng Heng Paper Products Co (Pte) Ltd.
- 6.4.5 Singapore Cartons Pte Ltd.
- 6.4.6 Interpak Industries Pte Ltd.
- 6.4.7 Union Containers (Pte) Limited
- 6.4.8 Stanpack Industries Pte Ltd.
- 6.4.9 Federal Packaging Industries Pte Ltd.
- 6.4.10 Hi-Rise Paper Products Pte. Ltd.
- 6.4.11 Apac Packaging Pte Ltd.
- 6.4.12 Asia Enviropak Pte. Ltd.
- 6.4.13 Sankawa Packaging (S) Pte Ltd.
- 6.4.14 Atlas Paper Products Pte Ltd.
- 6.4.15 Advance Carton Pte Ltd.
- 6.4.16 Paper Carpenter Pte. Ltd.
- 6.4.17 Nippon Kompo Shizai Singapore Pte Ltd.
- 6.4.18 Acepac International (S) Pte Ltd.
- 6.4.19 AMB Packaging Pte Ltd.
7 MARKET OPPORTUNITIES AND FUTURE OUTLOOK
- 7.1 White-Space and Unmet-Need Assessment
