

|
시장보고서
상품코드
2138094
전기 버스 시장 : 용도별, 배터리 용량별, 배터리 유형별, 구성요소별, 소비자별, 드라이브트레인 아키텍처별, 차량 총중량별, 버스 전장별, 자율주행 레벨별, 전력 출력별, 추진 방식별, 항속거리별, 좌석수별, 지역별 - 세계 예측(-2035년)Electric Buses Market by Propulsion (BEV, FCEV), Battery (LFP, NMC, NCA), Length (<9, 9-14, >14m), Battery Capacity (<=400, >400kWh), Application, Seating Capacity, Range, Power Output, Component, Consumer, and Region - Global Forecast to 2035 |
||||||

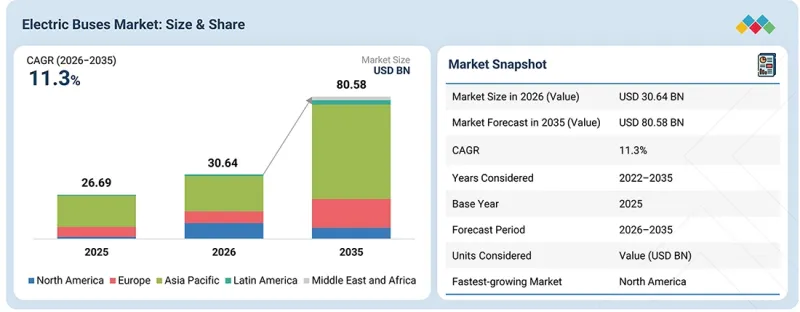
세계의 전기 버스 시장 규모는 2026년 306억 4,000만 달러에서 연평균 성장률(CAGR) 11.3%로 확대되어 2035년에는 805억 8,000만 달러에 달할 것으로 전망됩니다.
기존의 도시 대중교통에 더해, 시장은 기업 직원 통근, 법인용 모빌리티, 공항 셔틀, 관광, 도시 간 운송, 스쿨버스, 지역 노선 등으로 확대되고 있으며, 주행 거리가 길고 일일 가동률이 높은 전기버스에 대한 새로운 수요가 발생하고 있습니다.
| 조사 범위 | |
|---|---|
| 조사 대상 기간 | 2022-2035년 |
| 기준 연도 | 2025년 |
| 예측 기간 | 2026-2033년 |
| 대상 단위 | 10억 달러 |
| 부문 | 용도별, 배터리 용량별, 배터리 유형별, 구성요소별, 소비자별, 드라이브트레인 아키텍처별, 차량 총중량별, 버스 전장별, 자율 레벨별, 전력 출력별, 추진 방식별, 항속거리별, 좌석수별, 지역별 |
| 대상 지역 | 아시아태평양, 북미, 유럽 |
배터리 용량, 급속 충전, 열 관리 및 차량 효율성 향상 덕분에 사업자들은 점점 더 가혹한 노선에서도 전기 버스를 도입할 수 있게 되었습니다. 한편, 차량 보유 사업자들은 차량의 초기 구매 가격뿐만 아니라 총 소유 비용, 차량 가동률 및 에너지 비용을 더욱 중요하게 여기고 있습니다. 이에 따라, 특히 충전 시간과 노선 유연성이 중요한 도시 간 노선이나 장거리 운행에서 주행 거리가 긴 BEV 및 FCEV에 대한 수요가 발생하고 있습니다.
2026년에는 정부 부문이 전기버스에 대한 최대 수요를 창출할 것으로 추정됩니다.
2026년에 정부 부문이 전기 버스 수요를 주도하는 이유는 대중교통 기관이 도시 지역의 버스 조달에서 큰 비중을 차지하고 있기 때문입니다. 많은 국가에서 국영 또는 지방자치단체 산하 교통공사는 일반적으로 버스 구매에 있어 최대의 단일 구매자입니다. 정부 부문 기관은 일원화된 조달, 차고를 거점으로 한 충전 인프라, 예측 가능한 운행 노선 등의 이점을 누리고 있으며, 이로 인해 분산된 민간 차량 운영에 비해 대규모 전기화가 더 쉽게 실현될 수 있습니다. 이러한 우위는 체계화된 조달 모델, 차량 교체 의무화, 그리고 전기 버스 도입에 수반되던 초기 비용 및 재정적 위험을 완화하는 민관 파트너십을 통해 강화되고 있습니다. 또한, 정부가 지원하는 자금 조달 메커니즘, 보조금 제도 및 전용 조달 프로그램을 통해 대중교통 기관의 초기 비용 장벽이 더욱 낮아지고 있습니다. 또한, 일부 국가에서는 대중교통 기관의 신규 전기버스 구매에 대해 특정 날짜 이후부터는 제로 배출을 의무화하는 장기적인 전기화 로드맵이 수립되어, 정책에 뒷받침된 지속적인 수요 전망이 형성되고 있습니다. 따라서 집중된 구매력, 지원적인 정책 체계, 그리고 구조적인 자금 지원이 결합되어, 예측 기간 동안 정부 및 대중교통 부문이 전기 버스 시장의 주요 수요 견인자로 계속 자리매김할 것으로 예상됩니다.
배터리 용량이 400kWh를 초과하는 부문은 예측 기간 동안 더 빠른 속도로 성장할 것으로 전망됩니다.
400kWh를 초과하는 부문은 지속적인 배터리 개발, 배터리 비용 하락, 충전 인프라 개선에 힘입어 더 빠른 속도로 성장하고 있습니다. 주요 제조사들은 승객 정원이나 차량 성능을 크게 저해하지 않으면서 버스의 주행 거리를 연장하기 위해 대용량 배터리 시스템을 점점 더 많이 도입하고 있습니다. 국제에너지기구(IEA)에 따르면, 배터리의 경제성도 개선되고 있으며, 전 세계 평균 배터리 가격은 2025년에 2024년 대비 8% 하락할 것으로 전망됩니다. 이는 대용량 배터리 팩의 상업적 실현 가능성을 뒷받침하는 것입니다. 동시에, 고출력 충전 및 차고 인프라의 발전으로 인해 대용량 배터리에 수반되는 운영상의 단점이 완화되고 있습니다. 또한, 400kWh를 초과하는 배터리 용량은 장거리 도시 노선뿐만 아니라 교외, 지방, 도시 간, 공항, 직원 수송 및 기타 이용률이 높은 용도에도 적합한 것으로 자리 잡고 있습니다. IEA 데이터에 따르면, 시판 중인 전기 버스 모델의 평균 주행 거리는 2025년에 360km에 달해 2020년 대비 약 15% 증가했습니다. 한편, 업계에서는 더 긴 주행 거리를 실현하는 모델 개발이 활발해지고 있습니다. 이는 전기 버스가 기존의 도시 교통의 틀을 넘어 보급됨에 따라 대용량 사양으로의 전환을 뒷받침하는 요인입니다. 민간 차량 운영업체 및 장거리 용도에서의 도입 확대에 따라, 배터리 용량이 400kWh를 초과하는 버스에 대한 수요가 더욱 가속화될 것으로 예상됩니다.
북미는 전기 버스 시장에서 가장 빠르게 성장하고 있는 지역입니다.
북미에서는 2025년에 일시적인 성장 둔화가 예상되지만, 전기 버스 시장은 장기적으로 강력한 성장 잠재력을 지닐 것으로 전망됩니다. 미국 내 제로 에미션 버스의 신규 등록 대수는 2024년 3,911대에서 2025년 2,626대로 25.9% 감소했으며, 신규 버스 등록에서 제로 에미션 버스가 차지하는 비율은 7.0%에서 4.4%로 떨어졌습니다. 그러나 이러한 감소는 전동화에서 구조적으로 이탈하는 것보다는 조달 둔화나 정책의 불확실성을 반영한 것입니다. 북미 전기 버스 시장은 주로 연방 정부의 제로 에미션 버스 자금 지원, 조달 우선순위, 그리고 전기 버스의 경제성에 대한 불확실성으로 인해 2029년까지 비교적 정체된 상태가 지속될 것으로 예상됩니다. 또한, 수입 버스, 배터리, 철강, 알루미늄 및 기타 부품에 대한 새로운 관세가 차량 비용을 상승시켜, 교통 기관들이 구매를 연기하거나 재검토하는 요인이 되었습니다. 그 결과, 예측에서는 이전의 성장 궤도로의 급격한 복귀를 가정하기보다는 BEV의 성장이 완만할 것으로 조정되었습니다. 2029년 이후에는 노후화된 대중교통 및 스쿨버스 차량의 교체 수요가 증가하고, 주 차원의 규제가 전기화를 지속적으로 뒷받침하며, 국내 생산이 확대되고 배터리 비용이 개선됨에 따라 회복이 예상됩니다. FCEV의 경우, 수소 인프라 부족, 차량 및 연료 비용 급등, 향후 수주 감소, 그리고 해당 지역의 OEM 공급 능력 제한으로 인해 훨씬 더 급격한 감소가 예상됩니다. 스쿨버스는 특히 캘리포니아주 및 기타 ZEV(무공해 차량)에 중점을 두는 주에서 대규모 교체 수요와 주 차원의 전동화 프로그램의 지원에 힘입어 계속해서 가장 큰 용도 분야가 될 전망입니다. 노선버스의 도입은 다소 완만한 회복세를 보일 가능성이 높습니다. NFI/New Flyer, Gillig, Blue Bird, Nova Bus/Volvo, BYD, REV Group과 같은 주요 기업들은 국내 생산 확대, 폭넓은 추진 시스템 포트폴리오 유지, 주 차원의 고객 관계 강화, 그리고 자금 조달 전망이 명확한 시장에 우선적으로 집중하는 등의 대응책을 마련하고 있습니다. 전반적으로 북미 시장은 구조적 전환이라기보다는 정책에 의한 일시적인 침체를 겪을 것으로 보이며, 2029년 이후에는 BEV가 완만하게 회복되는 반면, FCEV의 도입 대수는 지속적인 감소가 예상됩니다.
전기 버스 시장의 주요 제조사로는 BYD Company Ltd.(중국), Yutong(중국), Xiamen King Long(중국), CRRC Corporation Limited(중국), Zhejiang Gelly Holding Group(중국), NFI Group(캐나다), AB Volvo(스웨덴), Solaris Bus & Coach SP. Z.O.O(폴란드), 그리고 Daimler Truck AG(독일) 등이 있습니다. 이들 기업은 전기 버스 시장에서의 점유율 확대를 도모하기 위해 신제품 개발 및 공급 계약 전략을 채택했습니다.
조사 범위:
본 조사에서는 전기 버스 시장을 세분화하여 추진 방식별(BEV, FCEV), 주행 거리별(300마일 이하, 300마일 초과), 버스 전장별(9m 미만, 9-14m, 14m 초과), 소비자별(민간, 정부), 용도별(노선버스, 장거리 버스, 스쿨버스, 기타), 배터리 용량별(400kWh 이하, 400kWh 이상), 구성요소별(모터, 배터리, 연료전지 스택, 배터리 관리 시스템, 배터리 냉각 시스템,DC-DC 컨버터, 인버터, AC/DC 충전기, EV 커넥터), 자율주행 수준별(반자율주행, 자율주행), 전력 출력별(250kW 이하, 250kW 이상), 좌석 수별(40석 이하, 40-70석, 70석 이상), 총중량(GVW)별(10톤 이하, 10-20톤, 20톤 이상), 및 지역별(아시아태평양, 북미, 중동 및 아프리카[MEA], 유럽, 라틴아메리카)로 분류되어 있습니다. 본 보고서에서는 전기 버스 시장의 생태계에서 두각을 나타내고 있는 스타트업 및 중소기업에 대한 경쟁 분석을 다루고 있습니다.
본 보고서의 범위에는 전기 버스 시장의 성장에 영향을 미치는 주요 요인에 대한 상세한 정보가 포함되어 있습니다. 주요 업계 플레이어에 대한 철저한 분석을 통해 각 기업의 사업 개요, 제품, 주요 전략, 계약, 제휴, 합의, 제품 출시, 합병 및 인수, 미시경제 지표, 그리고 전기 버스 시장의 최근 동향에 대한 인사이트를 얻을 수 있습니다.
본 보고서를 구매할 때의 주요 이점:
본 보고서는 시장을 선도하는 기업 및 신규 진입 기업에게 전기 버스 시장 전체 및 각 하위 부문의 매출에 대한 가장 정확한 추정치를 제공합니다. 본 보고서에는 종합적인 시장 점유율 분석, 공급망 분석, 부품 제조업체에 대한 상세한 목록 및 인사이트, 그리고 경쟁 구도가 포함되어 있습니다. 또한 이해관계자가 시장 동향을 파악할 수 있도록 지원하며, 주요 시장 촉진요인, 억제요인, 과제 및 기회에 대한 정보를 제공합니다.
본 보고서는 다음 사항에 대한 인사이트를 제공합니다:
- 주요 촉진요인(차량 조달에서 노선 경제성 최적화로의 전환, 다중 노선 대응 전기 버스의 규모 확대를 가능하게 하는 플랫폼의 모듈화) 분석, 제약요인(CNG 및 바이오연료 버스에 비해 전기 버스의 보급 둔화), 기회(특정 상용차용 배터리 교체 솔루션, 전기 버스·차고·에너지 솔루션의 통합), 그리고 과제(지속적인 정지 및 출발이 반복되는 운행 주기 하에서의 고출력 e-액슬 내구성, 극한 기온 및 높은 공조 부하 상황에서의 주행 거리 유지)에 대한 인사이트를 제공합니다.
- 제품 개발/혁신 : 전기 버스 시장의 향후 기술, 연구 개발 활동, 그리고 제품 및 서비스 출시에 관한 상세한 인사이트
- 시장 개발 : 수익성이 높은 시장에 대한 종합적인 정보(본 보고서에서는 다양한 지역의 전기 버스 시장을 분석하고 있습니다)
- 시장 다각화 : 전기 버스 시장의 신제품·서비스, 미개척 지역, 최근 동향 및 투자에 관한 종합적인 정보
- 경쟁 분석 : BYD Company Ltd.(중국), Yutong(중국), Xiamen King Long(중국), CRRC Corporation Limited(중국), Zhejiang Geely Holding Group(중국) 등 전기 버스 시장의 주요 기업들의 시장 점유율, 성장 전략 및 서비스 제공 내용에 대한 상세한 평가.
자주 묻는 질문
목차
제1장 소개
제2장 주요 요약
제3장 주요 인사이트
제4장 시장 개요
제5장 산업 동향
제6장 고객 상황과 구매 행동
제7장 규제 상황
제8장 업계 동향 : 기술 진보, 특허, 혁신, 그리고 향후 전략적 응용
제9장 용도별 전기 버스 시장
제10장 전기 버스 시장(배터리 용량별)
제11장 전기 버스 시장(배터리 유형별)
제12장 전기 버스 시장(구성요소별)
제13장 전기 버스 시장(소비자별)
제14장 전기 버스 시장(드라이브트레인 아키텍처별)
제15장 전기 버스 시장(차량 총중량별)
제16장 전기 버스 시장(버스 전장별)
제17장 전기 버스 시장(자율주행 레벨별)
제18장 전기 버스 시장(전력 출력별)
제19장 전기 버스 시장(추진 방식별)
제20장 전기 버스 시장(항속거리별)
제21장 전기 버스 시장(좌석수별)
제22장 전기 버스 시장(지역별)
제23장 경쟁 구도
제24장 기업 개요
제25장 조사 방법
제26장 부록
KSM 26.10.08The global electric buses market is projected to grow from USD 30.64 billion in 2026 and reach USD 80.58 billion in 2035, at a CAGR of 11.3%. Beyond traditional municipal transit, the market is expanding into private employee transportation, corporate mobility, airport transfers, tourism, intercity services, school transportation, and regional routes, creating new demand for electric buses with longer range and higher daily utilization.
| Scope of the Report | |
|---|---|
| Years Considered for the Study | 2022-2035 |
| Base Year | 2025 |
| Forecast Period | 2026-2033 |
| Units Considered | USD billion |
| Segments | By propulsion, length of bus, component, range, power output, battery capacity, application, battery type, seating capacity, consumers, GVW, level of autonomy |
| Regions covered | Asia Pacific, North America, Europe |
Improvements in battery capacity, fast charging, thermal management, and vehicle efficiency are enabling operators to deploy electric buses on increasingly demanding routes, while fleet operators are placing greater emphasis on total cost of ownership, vehicle utilization, and energy costs rather than only upfront vehicle price. This is also creating opportunities for high-range BEVs and FCEVs, particularly for intercity and high-mileage operations where charging time and route flexibility are critical.
The government sector is estimated to generate the largest demand for electric buses in 2026.
The government sector dominates the electric bus demand in 2026 because public transport authorities control a large share of urban bus procurement. State-owned or municipal transit corporations are typically the largest single buyers of buses in most countries. The government sector bodies benefit from centralized purchasing, depot-based charging infrastructure, and predictable route operations that make large-scale electrification more feasible than fragmented private-fleet applications. This dominance is reinforced through structured procurement models, fleet-replacement mandates, and public-private partnerships that reduce the upfront cost and financial risk historically associated with e-bus adoption. Furthermore, government-backed funding mechanisms, subsidy schemes, and dedicated procurement programs further lower the upfront cost barrier for transit authorities. In addition, several countries have established long-term electrification roadmaps that require new electric bus purchases by public transit agencies to be zero-emission beyond certain dates, creating sustained, policy-backed demand visibility. Thus, the combination of concentrated buying power, supportive policy frameworks, and structural funding support is expected to keep the government and public-transit segment as the anchor demand driver for the electric buses market through the forecast period.
The above 400 kWh battery capacity is expected to grow at a faster rate during the forecast period.
The above 400 kWh segment is growing at a faster rate as it is supported by continuous battery development, declining battery costs, and improvements in charging infrastructure. Key manufacturers are increasingly introducing higher-capacity battery systems to extend bus range without significantly compromising passenger capacity or vehicle performance. According to the International Energy Agency (IEA), battery economics are also improving, with global average battery prices declining to 8% in 2025 compared to 2024. This supports the commercial viability of larger battery packs. At the same time, advances in high-power charging and depot infrastructure are reducing the operational penalty associated with larger batteries. Moreover, battery capacities above 400 kWh are becoming suitable not only for longer urban routes but also for suburban, regional, intercity, airport, employee-transport, and other high-utilization applications. The IEA data shows that the average range of available battery-electric bus models reached 360 km in 2025, around 15% higher than in 2020, while the industry is increasingly developing models capable of much longer ranges. This supports the shift toward higher-capacity configurations as electric buses expand beyond traditional city transit. Growing adoption by private fleet operators and long-distance applications is expected to further accelerate demand for >400 kWh battery capacity buses.
North America is the fastest-growing region for the electric buses market.
North America is expected to offer strong long-term growth potential for electric buses despite a temporary slowdown in 2025. US zero-emission bus registrations declined 25.9%, from 3,911 units in 2024 to 2,626 units in 2025, reducing the zero-emission share of new bus registrations from 7.0% to 4.4%. However, the decline reflects slower procurement and policy uncertainty rather than a structural move away from electrification. North America's electric bus market is expected to remain relatively stagnant through 2029, primarily because of uncertainty around federal zero-emission bus funding, procurement priorities, and the economics of electric buses. Moreover, new tariffs on imported buses, batteries, steel, aluminum and other components increased vehicle costs and encouraged transit agencies to delay or reassess purchases. As a result, BEV growth has been moderated in the forecast rather than assuming a rapid return to the previous growth trajectory, with recovery expected after 2029 as aging transit and school-bus fleets require replacement, state-level mandates continue to support electrification, domestic manufacturing expands, and battery costs improve. FCEVs are expected to decline much more sharply because of limited hydrogen infrastructure, higher vehicle and fuel costs, fewer upcoming orders and limited OEM availability in the region. School buses are expected to remain the largest application, supported by the large replacement requirement and state-level electrification programs, particularly in California and other ZEV-focused states. Transit-bus adoption is likely to recover more gradually. Major players such as NFI/New Flyer, Gillig, Blue Bird, Nova Bus/Volvo, BYD, and REV Group are responding by increasing domestic production, maintaining broader propulsion portfolios, strengthening state-level customer relationships, and prioritizing markets with clearer funding visibility. Overall, the North American market is likely to experience a policy-driven pause rather than a structural reversal, with moderate BEV recovery after 2029 but a sustained decline in FCEV deployment.
Break-up of the profile of primary participants in the electric buses market:
By Companies: Bus Battery Manufacturers - 30%, OEMs - 70%
By Designation: Manager level - 50%, C-Level Executives - 30%, Others - 20%
By Region: North America - 10%, Europe - 30%, and Asia Pacific - 60%
Major manufacturers in the electric buses market include BYD Company Ltd. (China), Yutong Co., Ltd. (China), Xiamen King Long (China), CRRC Corporation Limited (China), Zhejiang Gelly Holding Group (China), NFI Group (Canada), AB Volvo (Sweden), Solaris Bus & Coach SP. Z.O.O (Poland), and Daimler Truck AG (Germany). These companies adopted new product development and supply contract strategies to gain traction in the electric buses market.
Research Coverage:
The study segments the electric buses market and forecasts the market size based on propulsion (BEVs, FCEVs), range (up to 300 miles, above 300 miles), length of bus (less than 9 m, 9-14 m, more than 14m), consumer (private, government), application (transit buses, coaches, school buses, and others), battery capacity (up to 400 kWh, Above 400 kWh), component (motors, batteries, fuel cell stacks, battery management systems, battery cooling systems, DC-DC converters, inverters, AC/DC chargers, EV connectors), level of autonomy (semi-autonomous, autonomous), power output (up to 250 kW, above 250 kW), seating capacity (up to 40 seats, 40-70 seats, above 70 seats), by GVW (Up to 10 tonnes, 10 to 20 tonnes, and above 20 tonnes), and region (Asia Pacific, North America, Middle East & Africa [MEA], Europe, and Latin America). This report covers the competitive analysis of upcoming startups/SMEs in the electric buses market ecosystem.
The report's scope covers detailed information regarding the major factors influencing the growth of the electric buses market. A thorough analysis of the key industry players has provided insights into their business overview, products, key strategies, contracts, partnerships, agreements, product launches, mergers & acquisitions, microeconomic indicators, and recent developments in the electric buses market.
Key Benefits of Buying the Report:
The report will help market leaders/new entrants with information on the closest approximations of the revenue numbers for the overall electric buses market and the subsegments. The report includes a comprehensive market share analysis, supply chain analysis, extensive lists and insights into component manufacturers, and a competitive landscape. The report also helps stakeholders understand the market pulse and provides information on key market drivers, restraints, challenges, and opportunities.
The report provides insights into the following points:
- Analysis of critical drivers (Shift from vehicle procurement to route-economics optimization, and Platform modularization enabling multi-route eBuses scaling), restraints (CNG and biofuel buses slowing adoption of electric buses), opportunities (Battery-swapping solutions for selected commercial fleets, Integrated eBuses-Depot-Energy Solutions), and challenges (High power e-axle durability under continues stop-go duty cycles, Maintaining range under extreme temperatures and heavy HVAC loads).
- Product Development/Innovation: Detailed insights into upcoming technologies, research & development activities, and product & service launches in the electric buses market
- Market Development: Comprehensive information about lucrative markets (the report analyzes the electric buses market across varied regions)
- Market Diversification: Exhaustive information about new products & services, untapped geographies, recent developments, and investments in the electric buses market
- Competitive Assessment: In-depth assessment of market shares, growth strategies, and service offerings of leading players in the electric buses market, such as BYD Company Ltd. (China), Yutong Co., Ltd. (China), Xiamen King Long (China), CRRC Corporation Limited (China), and Zhejiang Geely Holding Group (China).
TABLE OF CONTENTS
1 INTRODUCTION
- 1.1 STUDY OBJECTIVES
- 1.2 MARKET DEFINITION
- 1.3 STUDY SCOPE
- 1.3.1 MARKET SEGMENTATION AND REGIONAL SNAPSHOT
- 1.3.2 INCLUSIONS AND EXCLUSIONS
- 1.4 YEARS CONSIDERED
- 1.5 CURRENCY CONSIDERED
- 1.6 STAKEHOLDERS
- 1.7 SUMMARY OF CHANGES
2 EXECUTIVE SUMMARY
- 2.1 MARKET INSIGHTS AND KEY HIGHLIGHTS
- 2.2 KEY MARKET PARTICIPANTS: MAPPING OF STRATEGIC DEVELOPMENTS
- 2.3 DISRUPTIVE TRENDS SHAPING MARKET
- 2.4 HIGH GROWTH SEGMENTS
- 2.5 REGIONAL SNAPSHOT: MARKET SIZE, GROWTH RATE, AND FORECAST
3 PREMIUM INSIGHTS
- 3.1 ATTRACTIVE OPPORTUNITIES FOR PLAYERS IN ELECTRIC BUSES MARKET
- 3.2 ELECTRIC BUSES MARKET, BY PROPULSION
- 3.3 ELECTRIC BUSES MARKET, BY RANGE
- 3.4 ELECTRIC BUSES MARKET, BY COMPONENT
- 3.5 ELECTRIC BUSES MARKET, BY CONSUMER
- 3.6 ELECTRIC BUSES MARKET, BY BATTERY CAPACITY
- 3.7 ELECTRIC BUSES MARKET, BY BATTERY TYPE
- 3.8 ELECTRIC BUSES MARKET, BY APPLICATION
- 3.9 ELECTRIC BUSES MARKET, BY POWER OUTPUT
- 3.10 ELECTRIC BUSES MARKET, BY LENGTH
- 3.11 ELECTRIC BUSES MARKET, BY SEATING CAPACITY
- 3.12 ELECTRIC BUSES MARKET, BY GVW
- 3.13 ELECTRIC BUSES MARKET, BY REGION
4 MARKET OVERVIEW
- 4.1 INTRODUCTION
- 4.2 MARKET DYNAMICS
- 4.2.1 DRIVERS
- 4.2.1.1 Shift from vehicle procurement to route-economics optimization
- 4.2.1.2 Platform modularization enables multi-route electric bus scaling
- 4.2.1.3 Growing availability of financing and leasing/business models
- 4.2.2 RESTRAINTS
- 4.2.2.1 CNG and biofuel buses slowing adoption of electric buses
- 4.2.3 OPPORTUNITIES
- 4.2.3.1 Battery swapping solutions for selected commercial fleets
- 4.2.3.2 Second-life and battery recycling ecosystem
- 4.2.3.3 Integrated electric buses depot energy solutions
- 4.2.4 CHALLENGES
- 4.2.4.1 High-power e-axle durability under continuous stop-and-go duty cycles
- 4.2.4.2 Maintaining range under extreme temperature and heavy HVAC loads
- 4.2.1 DRIVERS
- 4.3 UNMET NEEDS AND WHITE SPACES
- 4.3.1 UNMET NEEDS
- 4.3.2 WHITE SPACES
- 4.4 INTERCONNECTED MARKET AND CROSS-SECTOR OPPORTUNITY
- 4.5 STRATEGIC MOVES BY KEY PLAYERS
5 INDUSTRIAL TRENDS
- 5.1 MACROECONOMIC OUTLOOK
- 5.1.1 INTRODUCTION
- 5.1.2 GDP TRENDS AND FORECAST
- 5.1.3 TRENDS IN ELECTRIC BUSES MARKET
- 5.1.3.1 Investment environment
- 5.2 SUPPLY CHAIN ANALYSIS
- 5.3 ECOSYSTEM ANALYSIS
- 5.4 ELECTRIC BUSES ECOSYSTEM
- 5.5 PRICING ANALYSIS
- 5.5.1 INDICATIVE PRICE OF ELECTRIC BUSES, BY REGION, 2026
- 5.5.1.1 Indicative price of electric buses, by region, 2026
- 5.5.1.2 Indicative price of electric buses, by application, 2026
- 5.5.1.3 Indicative price of electric buses, by propulsion, 2026
- 5.5.1 INDICATIVE PRICE OF ELECTRIC BUSES, BY REGION, 2026
- 5.6 KEY CONFERENCES AND EVENTS, 2026-2028
- 5.7 TRADE ANALYSIS
- 5.7.1 IMPORT SCENARIO (HS CODE 870240)
- 5.7.2 EXPORT SCENARIO (HS CODE 870240)
- 5.8 TRENDS/DISRUPTIONS IMPACTING CUSTOMER BUSINESS
- 5.9 INVESTMENT AND FUNDING SCENARIO
- 5.10 CASE STUDY ANALYSIS
- 5.10.1 COMPLETE TRANSITION TO ELECTRIC BUSES IN SHENZHEN, CHINA
- 5.10.2 ZENOBE HELPED STAGECOACH INCORPORATE CHARGING INFRASTRUCTURE AND INSTALL CUSTOM MANAGEMENT SOFTWARE SYSTEM
- 5.10.3 HSL WAS AWARDED OPERATIONS BASED ON OPEN TENDERS UNDER CHARGING-AS-A-SERVICE (CAAS) BUSINESS MODEL
- 5.10.4 AI-POWERED SOFTWARE IMPLEMENTED TO HELP FLEET OPERATORS CHARGE ELECTRIC BUSES
- 5.10.5 HIGHLAND ELECTRIC FLEETS, IN PARTNERSHIP WITH NATIONAL GRID, PROVIDED ELECTRIC SCHOOL BUSES AND COORDINATED ITS PARTICIPATION IN V2G PROGRAM SCHOOL BUSES
- 5.10.6 VERMONT ELECTRIC SCHOOL AND TRANSIT BUS PILOT PROGRAM IMPLEMENTED TO FACILITATE COST-EFFECTIVE ELECTRIFICATION
- 5.10.7 FLEET TEST & EVALUATION TEAM AT NREL SUPPORTED AVTA BY CONDUCTING ASSESSMENTS OF MEDIUM- AND HEAVY-DUTY VEHICLES, ELECTRIC BUSES, AND TROLLEYS
- 5.10.8 EVENERGI DEVELOPED FRAMEWORK TO DETERMINE OPTIMAL COMBINATION OF DEPOT LAYOUTS, CHARGER SPEEDS, AND CHARGER TYPES
- 5.11 TOTAL COST OF OWNERSHIP
- 5.12 ELECTRIC BUSES REGISTRATION IN EUROPE, 2025-2024
- 5.13 BILL OF MATERIALS ANALYSIS
- 5.14 OEM ANALYSIS
- 5.14.1 INTRODUCTION
- 5.14.2 ELECTRIC AND ICE BUS MODELS: LENGTH VS. NUMBER OF SEATS
- 5.14.3 ELECTRIC BUS MODELS: LENGTH VS. NUMBER OF SEATS
- 5.14.4 BATTERY CAPACITY VS. DRIVE RANGE VS. PAX
- 5.15 ELECTRIC BUS DRIVE MOTOR SUPPLIERS, BY OEM AND REGION, 2026
- 5.16 ELECTRIC BUS BATTERY CELL SUPPLIERS, BY OEM AND REGION, 2026
6 CUSTOMER LANDSCAPE AND BUYER BEHAVIOR
- 6.1 DECISION-MAKING PROCESS
- 6.2 KEY STAKEHOLDERS & BUYING CRITERIA
- 6.3 ADOPTION BARRIERS AND INTERNAL CHALLENGES
- 6.4 UNMET NEEDS FROM VARIOUS END-USE INDUSTRIES
- 6.5 MARKET PROFITABILITY
- 6.5.1 MARKET PROFITABILITY FOR ELECTRIC BUSES
7 REGULATORY LANDSCAPE
- 7.1 INTRODUCTION
- 7.2 REGULATORY BODIES, GOVERNMENT AGENCIES, AND OTHER ORGANIZATIONS
- 7.2.1 NORTH AMERICA
- 7.2.2 EUROPE
- 7.2.3 ASIA PACIFIC
- 7.2.4 LATIN AMERICA
- 7.2.5 MIDDLE EAST & AFRICA
- 7.2.6 REGULATORY BODIES, GOVERNMENT AGENCIES, AND OTHER ORGANIZATIONS, BY REGION
8 INDUSTRY TRENDS: TECHNOLOGICAL ADVANCEMENTS, PATENTS, INNOVATIONS, AND FUTURE STRATEGIC APPLICATIONS
- 8.1 PATENT ANALYSIS
- 8.1.1 INTRODUCTION
9 ELECTRIC BUSES MARKET, BY APPLICATION
- 9.1 INTRODUCTION
- 9.2 CITY/TRANSIT BUSES
- 9.2.1 NEED TO IMPROVE AIR QUALITY IN CITIES TO DRIVE DEMAND
- 9.3 COACHES
- 9.3.1 GROWING DEMAND FOR SUSTAINABLE LONG-DISTANCE TRAVEL TO DRIVE DEMAND
- 9.4 SCHOOL BUSES
- 9.4.1 GROWING DEMAND IN NORTH AMERICA TO DRIVE THE ELECTRIC SCHOOL BUSES MARKET
- 9.5 OTHER APPLICATIONS
- 9.6 KEY INDUSTRY INSIGHTS
10 ELECTRIC BUSES MARKET, BY BATTERY CAPACITY
- 10.1 INTRODUCTION
- 10.2 UP TO 400 KWH
- 10.2.1 DEPLOYMENT IN INTRACITY TRANSPORT TO PROPEL GROWTH
- 10.3 ABOVE 400 KWH
- 10.3.1 USED FOR LONG-DISTANCE COMMUTE
- 10.4 KEY INDUSTRY INSIGHTS
11 ELECTRIC BUSES MARKET, BY BATTERY TYPE
- 11.1 INTRODUCTION
- 11.2 NMC BATTERIES
- 11.2.1 INCREASED PREFERENCE FOR HIGH ENERGY DENSITY
- 11.3 LFP BATTERIES
- 11.3.1 DEMAND FOR LOW-COST AND GOOD THERMAL STABILITY
- 11.4 NCA BATTERIES
- 11.4.1 BENEFITS ASSOCIATED WITH HIGH ENERGY DENSITY AND LONG-LIFE CYCLE
- 11.5 OTHER BATTERIES
- 11.6 KEY INDUSTRY INSIGHTS
12 ELECTRIC BUSES MARKET, BY COMPONENT
- 12.1 INTRODUCTION
- 12.2 MOTORS
- 12.2.1 HIGHER EFFICIENCY THAN TRADITIONAL COMBUSTION ENGINES TO DRIVE GROWTH
- 12.3 BATTERIES
- 12.3.1 DECREASING PRICE OF LITHIUM-ION BATTERIES TO DRIVE GROWTH
- 12.4 FUEL CELL STACKS
- 12.4.1 INCREASING DEMAND FOR HYDROGEN FUEL CELL ELECTRIC BUSES TO DRIVE GROWTH
- 12.5 BATTERY MANAGEMENT SYSTEMS
- 12.5.1 NEED FOR EFFICIENT BATTERY OPTIMIZATION IN ELECTRIC BUSES TO DRIVE GROWTH
- 12.6 BATTERY COOLING SYSTEMS
- 12.6.1 GROWING FOCUS ON INCREASING BATTERY LIFE AND IMPROVING THERMAL MANAGEMENT TO DRIVE GROWTH
- 12.7 DC-DC CONVERTERS
- 12.7.1 KEY SAFETY SYSTEMS IN ELECTRIC BUSES
- 12.8 INVERTERS
- 12.8.1 GROWING DEMAND FOR ELECTRIC BUSES WITH HIGHER RANGE TO DRIVE GROWTH
- 12.9 AC/DC CHARGERS
- 12.9.1 CRITICAL TO OVERALL OPERATION AND EFFICIENCY OF ELECTRIC BUSES
- 12.10 EV CONNECTORS
- 12.10.1 INCREASING INVESTMENTS IN SUSTAINABLE URBAN TRANSPORTATION INITIATIVES TO DRIVE GROWTH
- 12.11 KEY INDUSTRY INSIGHTS
13 ELECTRIC BUSES MARKET, BY CONSUMER
- 13.1 INTRODUCTION
- 13.2 PRIVATE
- 13.2.1 GOVERNMENT SUBSIDIES TO PROMOTE ADOPTION OF ELECTRIC BUSES
- 13.3 PUBLIC
- 13.3.1 USE OF ELECTRIC BUSES FOR PUBLIC TRANSPORTATION
- 13.4 KEY INDUSTRY INSIGHTS
14 ELECTRIC BUSES MARKET, BY DRIVETRAIN ARCHITECTURE
- 14.1 INTRODUCTION
- 14.2 CENTRAL MOTOR
- 14.3 INTEGRATED E-AXLE
- 14.4 HUB/IN-WHEEL MOTOR
- 14.5 KEY INDUSTRY INSIGHTS
15 ELECTRIC BUSES MARKET, BY GROSS VEHICLE WEIGHT (GVW)
- 15.1 INTRODUCTION
- 15.2 UP TO 10 TONNES
- 15.2.1 NEED FOR ELECTRIC BUSES FOR SHORT-DISTANCE SHUTTLES TO DRIVE GROWTH
- 15.3 10-20 TONNES
- 15.3.1 ASIA PACIFIC TO LEAD MARKET IN THIS SEGMENT
- 15.4 ABOVE 20 TONNES
- 15.4.1 ENGINEERED FOR BIGGER AND TEDIOUS OPERATIONS
- 15.5 KEY INDUSTRY INSIGHTS
16 ELECTRIC BUSES MARKET, BY LENGTH OF BUSES
- 16.1 INTRODUCTION
- 16.2 LESS THAN 9 M
- 16.2.1 EASY MANEUVERING ON COMPACT ROADS
- 16.3 9-14 M
- 16.3.1 SUITABLE FOR FULL-DAY OPERATIONS
- 16.4 MORE THAN 14 M
- 16.4.1 GROWING NUMBER OF ARTICULATED ELECTRIC BUSES TO DRIVE MARKET
- 16.5 KEY INDUSTRY INSIGHTS
17 ELECTRIC BUSES MARKET, BY LEVEL OF AUTONOMY
- 17.1 INTRODUCTION
- 17.2 SEMI-AUTONOMOUS
- 17.3 AUTONOMOUS
- 17.4 KEY INDUSTRY INSIGHTS
18 ELECTRIC BUSES MARKET, BY POWER OUTPUT
- 18.1 INTRODUCTION
- 18.2 UP TO 250 KW
- 18.2.1 WIDELY USED IN PUBLIC TRANSPORT BUSES
- 18.3 ABOVE 250 KW
- 18.3.1 DEMAND FOR HIGH-PERFORMANCE ELECTRIC BUSES TO DRIVE MARKET
- 18.4 KEY PRIMARY INSIGHTS
19 ELECTRIC BUSES MARKET, BY PROPULSION
- 19.1 INTRODUCTION
- 19.2 BATTERY ELECTRIC BUSES (BEV)
- 19.2.1 FALLING BATTERY PRICES AND GOVERNMENT INCENTIVES TO ELECTRIFY PUBLIC BUS FLEETS
- 19.3 FUEL CELL ELECTRIC BUSES (FCEV)
- 19.3.1 SUSTAINABLE PRODUCTION OF HYDROGEN TO DRIVE GROWTH
- 19.4 KEY INDUSTRY INSIGHTS
20 ELECTRIC BUSES MARKET, BY RANGE
- 20.1 INTRODUCTION
- 20.1.1 SUITABLE FOR URBAN AND SUBURBAN ROUTES WITH FREQUENT STOPS AND SHORTER DISTANCES BETWEEN CHARGING POINTS
- 20.2 ABOVE 300 MILES
- 20.2.1 INCREASING DEMAND FOR INTERCITY ELECTRIC BUSES TO DRIVE MARKET
- 20.3 KEY PRIMARY INSIGHTS
21 ELECTRIC BUSES MARKET, BY SEATING CAPACITY
- 21.1 INTRODUCTION
- 21.2 UP TO 40 SEATS
- 21.2.1 NEED FOR ELECTRIC BUSES FOR SHORT-DISTANCE SHUTTLES TO DRIVE DEMAND
- 21.3 40-70 SEATS
- 21.3.1 SUITABLE FOR DENSELY POPULATED AREAS
- 21.4 ABOVE 70 SEATS
- 21.4.1 NEED FOR HIGHER PASSENGER-CARRYING CAPABILITIES TO DRIVE DEMAND
- 21.5 KEY INDUSTRY INSIGHTS
22 ELECTRIC BUSES MARKET, BY REGION
- 22.1 INTRODUCTION
- 22.2 ASIA PACIFIC
- 22.2.1 CHINA
- 22.2.1.1 Widespread adoption of electric buses in public transport and presence of leading OEMs to boost growth
- 22.2.2 JAPAN
- 22.2.2.1 Focus on developing advanced electric buses to drive market
- 22.2.3 INDIA
- 22.2.3.1 Government support for electrification of public transport to propel demand for electric buses
- 22.2.4 SOUTH KOREA
- 22.2.4.1 Focus on electrification of public transport fleets to boost growth
- 22.2.5 SINGAPORE
- 22.2.5.1 Growing emphasis on promoting green public transport by 2040 to boost growth
- 22.2.6 INDONESIA
- 22.2.6.1 Government's commitment to improving air quality to spur demand
- 22.2.7 AUSTRALIA
- 22.2.7.1 Increasing awareness regarding climate change to drive growth
- 22.2.1 CHINA
- 22.3 EUROPE
- 22.3.1 FRANCE
- 22.3.1.1 Aim for all-electric public transport fleet by 2025 to promote use of electric buses
- 22.3.2 GERMANY
- 22.3.2.1 Increased government incentives and investments for infrastructure development to boost market
- 22.3.3 SPAIN
- 22.3.3.1 Government's focus on replacing existing public transport fleet with electric buses to boost growth
- 22.3.4 ITALY
- 22.3.4.1 Rising concerns about emissions to encourage government to adopt electrification of public transport system
- 22.3.5 NORWAY
- 22.3.5.1 Rising government support and schemes for electric buses to increase demand
- 22.3.6 SWEDEN
- 22.3.6.1 Presence of market-leading OEMs to support growth of electric buses market
- 22.3.7 DENMARK
- 22.3.7.1 Favorable government regulations to support growth of electric buses market
- 22.3.8 NETHERLANDS
- 22.3.8.1 Increased orders and deliveries of electric buses to boost demand
- 22.3.9 BELGIUM
- 22.3.9.1 Investments in electrification of public transport to drive growth
- 22.3.10 UK
- 22.3.10.1 Stringent regulations for emission-free buses to boost adoption of electric buses
- 22.3.11 FINLAND
- 22.3.11.1 Continuous need to reduce carbon emissions to drive growth
- 22.3.12 POLAND
- 22.3.12.1 Push toward sustainable public transportation to spur demand for electric buses
- 22.3.1 FRANCE
- 22.4 NORTH AMERICA
- 22.4.1 US
- 22.4.1.1 Government programs to promote zero-emission vehicles to boost growth
- 22.4.2 CANADA
- 22.4.2.1 Government subsidies and presence of key players to boost adoption of electric school buses
- 22.4.1 US
- 22.5 LATIN AMERICA
- 22.5.1 ARGENTINA
- 22.5.1.1 Demand for electrification of bus fleets to boost demand for advanced electric buses
- 22.5.2 BRAZIL
- 22.5.2.1 Growing environmental concerns to lead to demand for electric buses
- 22.5.3 CHILE
- 22.5.3.1 Government's focus on promoting emission-free public transport to encourage use of electric buses
- 22.5.4 MEXICO
- 22.5.4.1 Rapid strategies undertaken by government to indicate growth of electric buses market
- 22.5.5 COLOMBIA
- 22.5.5.1 Increasing government initiatives for electric bus purchases to drive market
- 22.5.1 ARGENTINA
- 22.6 MIDDLE EAST & AFRICA
- 22.6.1 SOUTH AFRICA
- 22.6.1.1 Investments by leading OEMs in advanced technologies in automotive sector to drive market
- 22.6.2 UAE
- 22.6.2.1 Growing electrification trend in cities to boost demand for electric buses
- 22.6.3 QATAR
- 22.6.3.1 Net-zero aims to push incorporation of electric buses
- 22.6.1 SOUTH AFRICA
23 COMPETITIVE LANDSCAPE
- 23.1 OVERVIEW
- 23.2 KEY PLAYER STRATEGIES/RIGHT TO WIN
- 23.3 REVENUE ANALYSIS
- 23.4 ELECTRIC BUS MARKET SHARE ANALYSIS, 2025
- 23.4.1 ASIA ELECTRIC BUS MARKET SHARE ANALYSIS, 2025
- 23.4.2 EUROPE ELECTRIC BUS MARKET SHARE ANALYSIS, 2025
- 23.4.3 NORTH AMERICA ELECTRIC BUS MARKET SHARE ANALYSIS, 2025
- 23.5 COMPANY VALUATION
- 23.6 FINANCIAL METRICS
- 23.7 BRAND/PRODUCT COMPARISON
- 23.8 COMPANY EVALUATION MATRIX: KEY PLAYERS, 2025
- 23.8.1 STARS
- 23.8.2 EMERGING LEADERS
- 23.8.3 PERVASIVE PLAYERS
- 23.8.4 PARTICIPANTS
- 23.8.5 COMPANY FOOTPRINT: KEY PLAYERS, 2025
- 23.9 COMPANY EVALUATION MATRIX: STARTUPS/SMES, 2025
- 23.9.1 PROGRESSIVE COMPANIES
- 23.9.2 RESPONSIVE COMPANIES
- 23.9.3 DYNAMIC COMPANIES
- 23.9.4 STARTING BLOCKS
- 23.9.5 COMPETITIVE BENCHMARKING
- 23.10 COMPETITIVE SCENARIO
- 23.10.1 PRODUCT LAUNCHES, DEVELOPMENTS, AND ENHANCEMENTS, SEPTEMBER 2022-JULY 2025
- 23.10.2 DEALS, FEBRUARY 2025-FEBRUARY 2026
- 23.10.3 EXPANSIONS, JULY 2025-MAY 2026
- 23.10.4 OTHERS, OCTOBER 2022-JULY 2025
24 COMPANY PROFILES
- 24.1 KEY PLAYERS
- 24.1.1 BYD COMPANY LTD.
- 24.1.1.1 Business overview
- 24.1.1.2 Products/Solutions offered
- 24.1.1.3 Recent developments
- 24.1.1.4 MnM view
- 24.1.1.4.1 Key strengths
- 24.1.1.4.2 Strategic choices
- 24.1.1.4.3 Weaknesses & competitive threats
- 24.1.2 YUTONG BUS CO., LTD.
- 24.1.2.1 Business overview
- 24.1.2.2 Products/Solutions offered
- 24.1.2.3 Recent developments
- 24.1.2.4 MnM view
- 24.1.2.4.1 Key Strengths
- 24.1.2.4.2 Strategic choices
- 24.1.2.4.3 Weaknesses & competitive threats
- 24.1.3 ZHEJIANG GEELY HOLDING GROUP
- 24.1.3.1 Business overview
- 24.1.3.2 Products/Solutions offered
- 24.1.3.3 Recent developments
- 24.1.3.4 MnM view
- 24.1.3.4.1 Key strengths
- 24.1.3.4.2 Strategic choices
- 24.1.3.4.3 Weaknesses & competitive threats
- 24.1.4 DAIMLER TRUCK AG
- 24.1.4.1 Business overview
- 24.1.4.2 Products/Solutions offered
- 24.1.4.3 Recent developments
- 24.1.4.4 MnM view
- 24.1.4.4.1 Key Strengths
- 24.1.4.4.2 Strategic choices
- 24.1.4.4.3 Weaknesses & competitive threats
- 24.1.5 NFI GROUP
- 24.1.5.1 Business overview
- 24.1.5.2 Products/Solutions offered
- 24.1.5.3 Recent developments
- 24.1.5.4 MnM view
- 24.1.5.4.1 Right to win
- 24.1.5.4.2 Strategic choices
- 24.1.5.4.3 Weaknesses & competitive threats
- 24.1.6 AB VOLVO
- 24.1.6.1 Business overview
- 24.1.6.2 Products/Solutions offered
- 24.1.6.3 Recent developments
- 24.1.7 CAF (SOLARIS BUS & COACH SP. Z O.O.)
- 24.1.7.1 Business overview
- 24.1.7.2 Products/Solutions offered
- 24.1.7.3 Recent developments
- 24.1.8 ZHONGTONG BUS HOLDING CO., LTD.
- 24.1.8.1 Business overview
- 24.1.8.2 Products/Solutions offered
- 24.1.8.3 Recent developments
- 24.1.9 CRRC CORPORATION LIMITED
- 24.1.9.1 Business overview
- 24.1.9.2 Products/Solutions offered
- 24.1.9.3 Recent developments
- 24.1.9.3.1 CCR Corporation Limited: Expansion
- 24.1.10 VDL GROEP
- 24.1.10.1 Business overview
- 24.1.10.2 Products/Solutions offered
- 24.1.10.3 Recent developments
- 24.1.11 EBUSCO
- 24.1.11.1 Business overview
- 24.1.11.2 Products/Solutions offered
- 24.1.11.3 Recent developments
- 24.1.12 XIAMEN KING LONG INTERNATIONAL TRADING CO., LTD.
- 24.1.12.1 Business overview
- 24.1.12.2 Products/Solutions offered
- 24.1.12.3 Recent developments
- 24.1.1 BYD COMPANY LTD.
- 24.2 OTHER PLAYERS
- 24.2.1 BLUE BIRD CORPORATION
- 24.2.2 GILLIG LLC.
- 24.2.3 THE LION ELECTRIC COMPANY
- 24.2.4 TATA MOTORS LIMITED.
- 24.2.5 ASHOK LEYLAND
- 24.2.6 CHANGSHA SUNDA NEW ENERGY TECHNOLOGY CO., LTD.
- 24.2.7 GREE ALTAIRNANO NEW ENERGY INC.
- 24.2.8 XIAMEN GOLDEN DRAGON BUS CO. LTD.
- 24.2.9 JBM GROUP
- 24.2.10 SCANIA AB
- 24.2.11 IRIZAR GROUP
- 24.2.12 IVECO S.P.A
- 24.2.13 BLUEBUS
- 24.2.14 BOZANKAYA
- 24.2.15 CAETANOBUS
- 24.2.16 CHARIOT MOTORS
- 24.2.17 HEULIEZ BUS
- 24.2.18 OTOKAR OTOMOTIV VE SAVUNMA SANAYI A.S.
- 24.2.19 TEMSA
- 24.2.20 URSUS S.A.
- 24.2.21 KARSAN OTOMOTIV SANAYII VE TICARET A.S.
- 24.2.22 MELLOR
- 24.2.23 HINO MOTORS, LTD.
- 24.2.24 ANHUI ANKAI AUTOMOBILE CO., LTD.
- 24.2.25 OLECTRA GREENTECH LIMITED
25 RESEARCH METHODOLOGY
- 25.1 RESEARCH DATA
- 25.1.1 SECONDARY DATA
- 25.1.1.1 Key secondary sources
- 25.1.1.2 Key data from secondary sources
- 25.1.2 PRIMARY DATA
- 25.1.2.1 Primary participants
- 25.1.1 SECONDARY DATA
- 25.2 MARKET SIZE ESTIMATION
- 25.2.1 BOTTOM-UP APPROACH
- 25.3 DATA TRIANGULATION
- 25.4 FACTOR ANALYSIS
- 25.5 RESEARCH ASSUMPTIONS AND RISK ASSESSMENT
- 25.6 RESEARCH LIMITATIONS
26 APPENDIX
- 26.1 KEY INDUSTRY INSIGHTS
- 26.2 DISCUSSION GUIDE
- 26.3 KNOWLEDGESTORE: MARKETSANDMARKETS' SUBSCRIPTION PORTAL
- 26.4 CUSTOMIZATION OPTIONS
- 26.5 RELATED REPORTS
- 26.6 AUTHOR DETAILS


