
|
시장보고서
상품코드
1683998
북미의 제초제 : 시장 점유율 분석, 산업 동향, 성장 예측(2025-2030년)North America Herbicide - Market Share Analysis, Industry Trends & Statistics, Growth Forecasts (2025 - 2030) |
||||||
■ 보고서에 따라 최신 정보로 업데이트하여 보내드립니다. 배송일정은 문의해 주시기 바랍니다.
가격
※ 부가세 별도
한글목차
영문목차
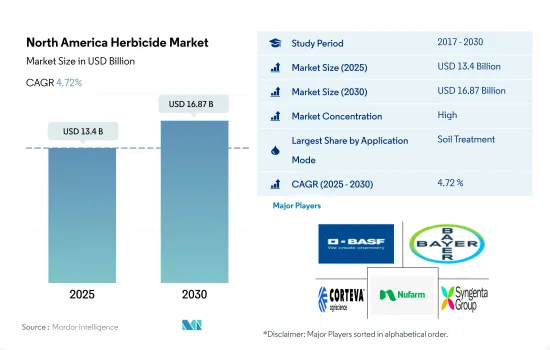
북미의 제초제 시장 규모는 2025년에 134억 달러로 추정되고, 2030년에는 168억 7,000만 달러에 이를 것으로 예측되며, 예측 기간 중(2025-2030년) CAGR은 4.72%를 나타낼 전망입니다.
북미의 제초제 시장을 지배하는 토양 살포제
- 잡초는 농업 시스템에서 수확량 손실과 품질 저하의 주요 원인입니다. 잡초는 작물과 빛, 물, 영양분을 놓고 경쟁합니다. 또한 잡초는 식물에서 식물로 병원균을 옮기는 파괴적인 곤충 매개체의 저장소 역할을 함으로써 작물 식물에 해를 끼칠 수 있습니다. 제초제를 사용하는 것은 다른 방법보다 저렴하고 노동력이 적게 들며 시간을 절약할 수 있기 때문에 가장 효과적인 잡초 관리 도구입니다. 다양한 잡초를 방제하기 위해 여러 가지 제초제 살포 기술을 사용할 수 있습니다.
- 토양 살포는 북미의 제초제 시장을 지배하며 2022년 48.8%의 시장 점유율을 차지했습니다. 주로 토양 처리를 통해 발아 전 제초제를 살포할 수 있습니다. 초기에 잡초의 압박을 줄임으로써 작물이 작물 재배 시즌에 순조로운 출발을 할 수 있습니다. 다양한 활성 성분과 적용 시기를 가진 토양 활성 제초제는 문제가 되는 내성 잡초를 처리하고 제초제 내성 발현을 늦추는 데 도움이 될 수 있습니다. 발아 전 제초제 중 가장 많이 사용되고 토양 처리를 통해 가장 효과적인 세 가지 성분은 옥사디아존, 펜디메탈린, 프레틸라클로르입니다.
- 잎 표면 살포는 북미에서 두 번째로 많이 사용되는 제초제 살포 방법으로, 2022년 29.8%의 시장 점유율을 차지할 것으로 예상됩니다. 발아 후 제초제는 이 방법을 통해 적용됩니다. 발아 후 제초제는 잎 표면에서 이동하여 목표 부위에 도달해야 효과를 발휘할 수 있습니다. 잎이 광합성을 활발하게 하기 위해 제초제를 살포하면 잎이 약제를 흡수해 잎 조직에 직접 영향을 주거나 식물의 다른 부분으로 제초제를 이동시킵니다. 잎 부문은 예측 기간 동안 상당한 성장을 기록 할 것으로 예상됩니다.
잡초의 만연에 의한 수확 손실 증가로 미국이 시장을 독점
- 잡초는 북미의 다양한 작물 재배 시스템에서 생산에 대한 주요 생물학적 제약입니다. 잡초로 인한 작물의 수확량 손실은 잡초 발아 시기, 잡초 밀도, 잡초의 종류, 작물의 종류 등 여러 요인에 따라 달라집니다. 잡초를 방제하지 않고 방치하면 수확량이 100% 손실될 수 있습니다. 제초제는 잡초 방제의 필수적인 부분입니다.
- 미국은 2022년 82.0%의 시장 점유율을 차지하며 시장을 지배하고 있습니다. 미국은 세계 최대의 밀 생산국이자 수출국 중 하나입니다. 그러나 잡초로 인한 밀 생산량 손실은 미국의 밀 생산과 농민의 경제적 번영에 심각한 위협이 되고 있습니다. 2022년 WSSA의 잡초 손실 위원회는 잡초로 인한 겨울 밀 수확량 손실을 약 25.6%로 추정했습니다. WSSA 잡초 손실 위원회는 모범 관리 사례와 함께 제초제를 사용하면 밀 수확량 손실이 60%에서 20%로 감소한다는 사실을 발견했습니다.
- 캐나다는 2022년 북미의 제초제 시장의 7.8%를 차지했습니다. 카놀라는 캐나다에서 재배되는 주요 작물입니다. 잡초로 인한 평균 카놀라 수확량 손실은 주/도별로 다양했습니다. 평균 수확 면적과 평균 수확량 기준으로 앨버타주의 수확량 손실률이 34.6%로 가장 높았으며, 7,200만 부셸의 손실이 있을 것으로 추정됩니다. 서스 캐처 원은 30.2%의 수확량 손실로 8,600만 부셸의 손실이 예상됩니다. 매니토바의 예상 수확량 손실은 18.1%로 1,900만 부셸의 손실이 예상됩니다. 노스다코타는 27.9%의 수확량 손실이 예상되어 2022년에 1,100만 부셸의 손실이 발생할 것으로 예상됩니다.
- 국내외 수요 증가에 큰 영향을 미치는 잡초 발생의 증가와 식량 안보에 대한 우려 증가가 시장을 주도하고 있습니다. 이 시장은 예측 기간(2023-2029년) 동안 4.9%의 연평균 성장률을 보일 것으로 예상됩니다.
북미의 제초제 시장 동향
제초제 제형의 발전이 북미 농가의 채택을 촉진
- 북미의 제초제 소비량은 2017년 이후 증가하고 있으며, 농경지 면적 1헥타르당 5.6kg에 달하고 있습니다. 미국은 1헥타르당 소비량이 가장 많아 2022년에는 2.7kg/헥타르가 됩니다.
- 제초제 내성 잡초의 발아과 확산이 증가함에 따라 제초제 내성 잡초를 방제하기 위해 더 많은 양의 제초제 또는 여러 가지 제초제를 사용하는 북미 농부들의 우려가 커지고 있습니다. 예를 들어, 팔머 아마란스와 일반 물대마는 글리포세이트에 내성이 있고, 말풀과 거대 돼지풀은 여러 제초제에 내성이 있으며, 코키아는 아세톨락테이트 합성효소(ALS) 억제 제초제에 내성이 있습니다.
- 또한 무경운 및 환원 경작과 같은 보존 경작 방식은 환경과 토양 건강에 이점이 있어 북미에서 인기를 얻고 있습니다. 예를 들어, 미국에서 집중 경작을 하는 농장의 수는 2012년과 2017년 사이에 35% 감소했으며, 캐나다와 멕시코의 농업 농장에서도 비슷한 추세가 관찰되었습니다. 이러한 집중 경작의 감소로 인해 잡초를 효과적으로 방제하기 위해 제초제에 대한 의존도가 높아졌습니다.
- 또한, 증가하는 식량 및 사료 수요를 충족하기 위해 고수익 작물에 대한 수요가 증가하면서 제초제 사용량도 증가하고 있습니다. 농부들은 잡초 경쟁을 효과적으로 관리하여 작물 수확량을 극대화하고 최적의 작물 성장과 생산성을 보장하기 위해 제초제 사용량 증가에 의존할 수 있습니다.
- 제초제 배합 기술의 발전과 유전자 변형 작물의 인기가 높아지면서 농부들은 잡초에만 영향을 미치는 제초제를 작물에 직접 살포할 수 있게 되었습니다. 이러한 추세는 북미에서 1헥타르당 제초제 사용량을 더욱 증가시킬 것으로 예상됩니다.
잡초로 인한 수확량 손실이 증가함에 따라 제초제에 대한 수요가 증가하여 제초제 가격이 상승하고 있습니다.
- 잡초의 확산은 농업에서 여전히 심각한 문제로 남아 있으며, 농부들에게 수확량 손실과 생산 비용 증가를 초래합니다. 아트라진, 파라쿼트, 글리포세이트는 북미에서 일반적으로 사용되는 제초제입니다.
- 염소계 트리아진 그룹으로 분류되는 전신 제초제인 아트라진은 일년생 풀과 광엽 잡초가 싹이 트기 전에 특별히 표적화하여 관리하는 데 사용됩니다. 아트라진을 함유한 제초제 제형은 옥수수, 스위트콘, 수수, 사탕수수, 밀, 마카다미아넛, 구아바 등 다양한 농작물에 사용할 수 있도록 승인되었습니다. 또한 아트라진은 종묘장/관상용 및 잔디 관리에도 사용됩니다.2022년 가치는 톤당 1만 3,800달러였습니다.
- 일반적으로 '파라코트'라고 불리는 염화파라코트는 북미에서 널리 사용되는 제초제로, 미국에서 최종 사용 제품명인 그라목손으로 잘 알려져 있습니다. 파라코트는 다양한 농업 및 비농업 환경에서 잡초 방제에 중요한 역할을 담당하고 있습니다. 또한 목화와 같은 작물을 수확하기 전에 건조시키는 데도 활용되고 있습니다. 2022년, 파라코트는 톤당 4,600달러의 가격을 유지했습니다.
- 글리포세이트는 발아 후 효과적인 전신적이고 광범위한 제초제 역할을 합니다. 최근 수십 년 동안 사용량이 크게 증가하여 가장 널리 사용되는 제초제 중 하나로 자리 잡았습니다. 글리포세이트 함유 제품은 액체 농축액, 고체, 즉시 사용 가능한 액상 등 다양한 형태로 제공됩니다. 이 화합물은 잡초 성장을 관리하기 위해 농업 및 비농업 분야에서 모두 사용됩니다. 2022년 현재 글리포세이트 시장 가치는 1톤당 16,600달러입니다.
북미의 제초제 산업 개요
북미의 제초제 시장은 상당히 통합되어 있으며 상위 5곳에서 73.81%를 차지하고 있습니다. 이 시장 주요 기업은 다음과 같습니다. BASF SE, Bayer AG, Corteva Agriscience, Nufarm Ltd and Syngenta Group(알파벳 순).
기타 혜택
- 엑셀 형식 시장 예측(ME) 시트
- 3개월의 애널리스트 지원
목차
제1장 주요 요약과 주요 조사 결과
제2장 보고서 제안
제3장 소개
- 조사의 전제조건과 시장 정의
- 조사 범위
- 조사 방법
제4장 주요 산업 동향
- 헥타르당 농약 소비량
- 유효성분의 가격 분석
- 규제 프레임워크
- 캐나다
- 멕시코
- 미국
- 밸류체인과 유통채널 분석
제5장 시장 세분화
- 적용 모드
- 약제 살포
- 잎면 살포
- 훈증
- 토양치료
- 작물 유형
- 상업 작물
- 과일 및 채소
- 곡물
- 콩류 및 유지종자
- 잔디 및 관상용
- 생산국
- 캐나다
- 멕시코
- 미국
- 기타 북미
제6장 경쟁 구도
- 주요 전략 동향
- 시장 점유율 분석
- 기업 상황
- 기업 프로파일(세계 수준 개요, 시장 수준 개요, 주요 사업 부문, 재무, 직원 수, 주요 정보, 시장 순위, 시장 점유율, 제품 및 서비스, 최근 동향 분석 포함)
- ADAMA Agricultural Solutions Ltd.
- American Vanguard Corporation
- BASF SE
- Bayer AG
- Corteva Agriscience
- FMC Corporation
- Nufarm Ltd
- Sumitomo Chemical Co. Ltd
- Syngenta Group
- UPL Limited
제7장 CEO에 대한 주요 전략적 질문
제8장 부록
- 세계의 개요
- 개요
- Five Forces 분석 프레임워크
- 세계의 밸류체인 분석
- 시장 역학(DROs)
- 출처 및 참고문헌
- 도표 일람
- 주요 인사이트
- 데이터 팩
- 용어집
The North America Herbicide Market size is estimated at 13.4 billion USD in 2025, and is expected to reach 16.87 billion USD by 2030, growing at a CAGR of 4.72% during the forecast period (2025-2030).
Soil applications dominate the North American herbicide market
- Weeds are a major contributor to yield loss and reduced quality in an agricultural system. They compete with the crop for light, water, and nutrients. Weeds can also harm crop plants by acting as reservoirs for destructive insect vectors that move pathogens from plant to plant. Using herbicides is the most effective weed management tool, as they are cheaper, require less labor, and save more time than other measures. Several herbicide application techniques can be used to control various weeds.
- Soil application dominated the North American herbicide market, accounting for a market share of 48.8% in 2022. Mainly, pre-emergence herbicides can be applied through soil treatment. By reducing weed pressures early on, crops can get off to a strong start in the cropping season. With different active ingredients and application timings, soil-active herbicides can help tackle troublesome resistant weeds and slow down the development of herbicide resistance. Among the pre-emergence herbicides, the three most commonly used and the most effective through soil treatment are oxadiazon, pendimethalin, and pretilachlor.
- Foliar application is the second most used method to apply herbicides in North America, accounting for a market share of 29.8% in the year 2022. Post-emergence herbicides will be applied through this method. A post-emergence herbicide must move from the leaf surface and reach the target site to be effective. As herbicide is applied to photosynthesize foliage actively, the leaves take up the chemical and either directly impact the leaf tissue or translocate the herbicide to other parts of the plants. The foliar segment is expected to record significant growth during the forecast period.
The United States dominated the market due to increased yield losses because of weed infestation
- Weeds are a major biotic constraint to production in different cropping systems of North America. Yield losses in crops due to weeds depend on several factors, such as weed emergence time, weed density, the type of weed, and the type of crops. If left uncontrolled, weeds can result in 100% yield loss. Herbicides are an integral part of weed control.
- The United States dominated the market, accounting for a market share of 82.0% in 2022. It is one of the world's largest wheat producers and exporters. However, wheat yield losses caused by weeds pose a serious threat to the country's wheat production and farmers' economic prosperity. In 2022, the WSSA's Weed Loss Committee estimated the winter wheat yield loss at approximately 25.6% due to weeds. The WSSA Weed Loss Committee found that the use of herbicides combined with best management practices resulted in a decrease in wheat yield loss from 60% to 20%.
- Canada accounted for 7.8% of the North American herbicide market in 2022. Canola is the major crop grown in the country. Average canola yield losses due to weeds varied by province/state. Alberta had the highest yield losses, estimated at 34.6%, a loss of 72 million bushels, based on the average harvested area and average yield. Saskatchewan had an estimated yield loss of 30.2%, a loss of 86 million bushels. Manitoba's estimated yield loss was 18.1%, resulting in a loss of 19 million bushels. North Dakota had an estimated yield loss of 27.9%, resulting in a loss of 11 million bushels in 2022.
- The increase in weed infestations, which greatly impacts the increasing domestic and international demand, and increasing concerns for food security are driving the market. The market is anticipated to witness a CAGR of 4.9% during the forecast period (2023-2029).
North America Herbicide Market Trends
Advancements in herbicide formulations are driving adoption among North American farmers
- Herbicide consumption in North America has been increasing since 2017 and reached 5.6 kg per hectare of cropland. The United States is the largest consumer per hectare, with 2.7 kg/hectare in 2022.
- The increase in the emergence and spread of herbicide-resistant weeds has been an increasing concern for farmers in North America, resulting in the application of higher amounts of herbicides or multiple herbicides to control herbicide-resistant weeds. For instance, Palmer amaranth and common water hemp are resistant to glyphosate, Horseweed and Giant ragweed are resistant to multiple herbicides, and Kochia is resistant to acetolactate synthase (ALS) inhibiting herbicides.
- Moreover, conservation tillage practices, such as no-till and reduced-till farming, have gained popularity in North America due to their environmental and soil health benefits. For instance, the number of farms practicing intensive tillage in the United States declined by 35% between 2012 and 2017, and a similar trend was observed in Canadian and Mexican agricultural farms. This decrease in intensive tillage has caused heavy reliance on herbicides to effectively control weeds.
- In addition, there is a growing demand for high-yielding crops to meet increasing food and feed requirements, which is boosting the need for higher herbicide usage. Farmers may rely on increased herbicide usage to effectively manage weed competition to maximize crop yields, ensuring optimal crop growth and productivity.
- Advancements in herbicide formulation technologies and the growing popularity of genetically modified crops have enabled farmers to apply herbicides directly to the crop, only affecting the weeds. These trends are further anticipated to increase herbicide usage per hectare of land in North America.
The rising yield losses due to weeds is driving the demand for herbicides, thereby driving the prices of herbicides
- Weed infestation remains a significant challenge in agriculture, causing yield losses and increased production costs for farmers. Atrazine, paraquat, and glyphosate are commonly used herbicides in North America.
- Atrazine, a systemic herbicide classified under the chlorinated triazine group, is employed to specifically target and manage annual grasses and broadleaf weeds before they sprout. Herbicide formulations containing atrazine are approved for application on a range of agricultural crops, such as corn, sweet corn, sorghum, sugarcane, wheat, macadamia nuts, and guava. In addition, atrazine is used in nursery/ornamental and turf management. Its value in 2022 was recorded at USD 13.8 thousand per metric ton.
- Paraquat dichloride, commonly referred to as "paraquat," is a widely utilized herbicide in North America, renowned for its well-known end-use product name, Gramoxone, in the United States. Paraquat assumes a vital role in weed control across a variety of agricultural and non-agricultural settings. Additionally, it finds application in crop desiccation, such as cotton, before harvesting. In the year 2022, paraquat held a price of USD 4.6 thousand per metric ton.
- Glyphosate functions as a systemic and wide-ranging herbicide effective post-emergence. Its utilization has witnessed substantial growth in recent decades, positioning it as one of the most prevalent herbicides. Glyphosate-containing products are available in diverse forms, including liquid concentrate, solid, and ready-to-use liquid. This compound finds application in both agricultural and non-agricultural contexts to manage weed growth. As of 2022, the market value of glyphosate stood at USD 16.6 thousand per metric ton.
North America Herbicide Industry Overview
The North America Herbicide Market is fairly consolidated, with the top five companies occupying 73.81%. The major players in this market are BASF SE, Bayer AG, Corteva Agriscience, Nufarm Ltd and Syngenta Group (sorted alphabetically).
Additional Benefits:
- The market estimate (ME) sheet in Excel format
- 3 months of analyst support
TABLE OF CONTENTS
1 EXECUTIVE SUMMARY & KEY FINDINGS
2 REPORT OFFERS
3 INTRODUCTION
- 3.1 Study Assumptions & Market Definition
- 3.2 Scope of the Study
- 3.3 Research Methodology
4 KEY INDUSTRY TRENDS
- 4.1 Consumption Of Pesticide Per Hectare
- 4.2 Pricing Analysis For Active Ingredients
- 4.3 Regulatory Framework
- 4.3.1 Canada
- 4.3.2 Mexico
- 4.3.3 United States
- 4.4 Value Chain & Distribution Channel Analysis
5 MARKET SEGMENTATION (includes market size in Value in USD and Volume, Forecasts up to 2030 and analysis of growth prospects)
- 5.1 Application Mode
- 5.1.1 Chemigation
- 5.1.2 Foliar
- 5.1.3 Fumigation
- 5.1.4 Soil Treatment
- 5.2 Crop Type
- 5.2.1 Commercial Crops
- 5.2.2 Fruits & Vegetables
- 5.2.3 Grains & Cereals
- 5.2.4 Pulses & Oilseeds
- 5.2.5 Turf & Ornamental
- 5.3 Country
- 5.3.1 Canada
- 5.3.2 Mexico
- 5.3.3 United States
- 5.3.4 Rest of North America
6 COMPETITIVE LANDSCAPE
- 6.1 Key Strategic Moves
- 6.2 Market Share Analysis
- 6.3 Company Landscape
- 6.4 Company Profiles (includes Global level Overview, Market level overview, Core Business Segments, Financials, Headcount, Key Information, Market Rank, Market Share, Products and Services, and analysis of Recent Developments)
- 6.4.1 ADAMA Agricultural Solutions Ltd.
- 6.4.2 American Vanguard Corporation
- 6.4.3 BASF SE
- 6.4.4 Bayer AG
- 6.4.5 Corteva Agriscience
- 6.4.6 FMC Corporation
- 6.4.7 Nufarm Ltd
- 6.4.8 Sumitomo Chemical Co. Ltd
- 6.4.9 Syngenta Group
- 6.4.10 UPL Limited
7 KEY STRATEGIC QUESTIONS FOR CROP PROTECTION CHEMICALS CEOS
8 APPENDIX
- 8.1 Global Overview
- 8.1.1 Overview
- 8.1.2 Porter's Five Forces Framework
- 8.1.3 Global Value Chain Analysis
- 8.1.4 Market Dynamics (DROs)
- 8.2 Sources & References
- 8.3 List of Tables & Figures
- 8.4 Primary Insights
- 8.5 Data Pack
- 8.6 Glossary of Terms
