
|
시장보고서
상품코드
2066704
유럽의 천연가스 : 시장 점유율 분석, 업계 동향 및 통계, 성장 예측(2026-2031년)Europe Natural Gas - Market Share Analysis, Industry Trends & Statistics, Growth Forecasts (2026 - 2031) |
||||||
 Mordor Intelligence
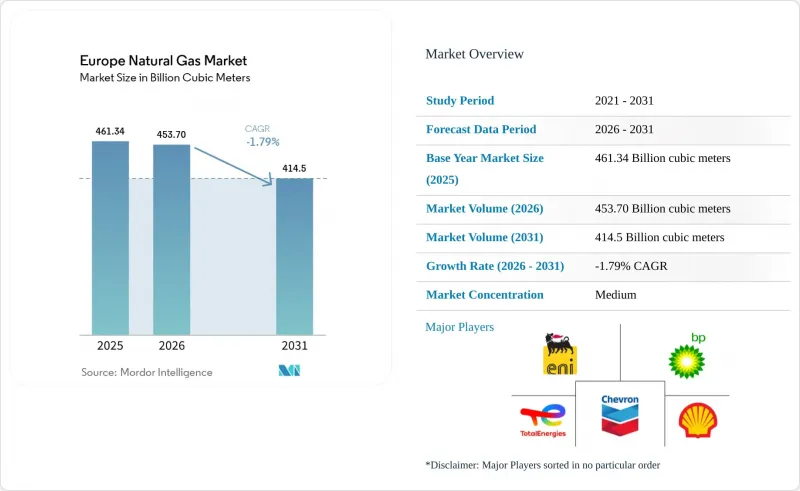
Mordor Intelligence에 의하면, 유럽의 천연가스 시장 규모는 2025년 4,613억 4,000만 입방미터로 평가되었습니다. 2026년 4,537억 입방미터로부터, 2031년까지 4,145억 입방미터로 축소될 것으로 예상되며 2026년부터 2031년까지 연평균 복합 성장률(CAGR)은 ―1.79%를 보일 전망입니다.
본 보고서는 유형(압축 천연가스, 파이프라인 천연가스, 액화 천연가스), 공급원(국내 생산-육상, 국내 생산-해상, LNG 수입), 최종 용도 분야(비료 생산, 도시가스 공급, 운송, 석유화학 원료, 기타) 및 지역(독일, 프랑스, 이탈리아, 스페인, 네덜란드, 노르웨이, 폴란드 및 기타 유럽 국가)별로 분류되어 있습니다.
유럽의 천연가스 시장 동향 및 인사이트
전력 및 지역 난방 시설에서의 석탄에서 가스로의 전환
2025년 12월 탄소배출권 가격이 CO2 1톤당 83.79유로까지 상승했고, 2030년까지 149유로에 달할 전망인 만큼, 독일과 폴란드의 지자체 운영 사업자들은 노후화된 석탄 보일러에서 가스 연소 열병합 발전 설비로 전환을 계속하고 있습니다. 중규모 도시의 경우, 지역 난방 네트워크에 대규모 히트펌프를 도입할 여력이 부족한 경우가 많기 때문에 단계적인 가스 전환이 선호되고 있습니다. 그러나 타이틀 트랜스퍼 시설(TTF)의 가격이 석탄에서 전환하는 데 필요한 임계치를 초과하는 경우가 있고, 베이스로드용 가스의 경제성이 떨어지고 있어 전환의 적기는 점점 좁아지고 있습니다. 2024년에는 가스 화력 발전량이 6% 감소했으나, 에너지 효율 지침에 따른 단기 준수 기한이 여전히 난방 분야의 잔여 전환을 뒷받침하고 있습니다. 송전망의 현대화와 재생에너지 보급이 진행됨에 따라, 지역 난방 분야의 천연가스 수요는 2029년 이후 정체될 것으로 예상되며, 단기적인 수요 증가가 지속되고 있음에도 불구하고 유럽의 천연가스 시장의 구조적 축소 추세를 더욱 심화시킬 것입니다.
유럽의 LNG 재기화 능력 확대
독일 내 FSRU의 급속한 도입과 폴란드 및 네덜란드에서의 확충에 힘입어, 유럽의 재기화 능력은 2022년부터 2025년 사이에 32% 증가하여 연간 약 270 BCM에 달했습니다. 독일에서만 해도 빌헬름스하펜, 브룬스뷔텔, 루브민, 슈타데 등 각 거점에서 24개월 동안 총 44.8 BCM 규모의 수입 시설이 가동을 시작했습니다. 폴란드의 그단스크 FSRU와 슈비노우이시체 시설 확충으로 인해 현재 총 14.4 BCM공급 능력이 확보되었으며, 바르샤바에는 해당 지역으로의 수출에 활용될 수 있는 잉여량이 발생하고 있습니다. 리투아니아의 클라이페다 터미널은 소규모 환적 물량 증가를 여실히 보여주고 있으며, 2025년에는 트럭 1,834대 분량의 적재를 기록했습니다. 예상되는 증설로 인해 2030년까지 처리 능력은 405 BCM에 달할 전망이지만, 수요 추세가 유지될 경우 이는 상당한 과잉 건설을 의미하므로, 자산 소유자들은 가동률 위험을 완화하기 위해 장기적인 인수 파트너를 점점 더 적극적으로 모색하고 있습니다.
러시아-우크라이나 전쟁 이후의 지정학적 공급 차질
제재와 수송 협정의 만료로 인해 공급원 다각화가 불가피해진 결과, 러시아산 파이프라인 공급량은 2021년 EU 공급량의 약 40%에서 2025년에는 13%로 급감했습니다. 유럽연합 집행위원회는 현재 2027년 말까지 러시아산 가스 수입을 전면 금지하는 것을 목표로 하고 있으며, 이에 따라 수요는 LNG 현물 시장과 노르웨이 파이프라인으로 집중되고 있습니다. 2025년, 노르웨이는 EU 수요의 31%를 공급했으나, 생산량이 정체되어 있어 향후 성장에는 한계가 있습니다. 2025년 2월에는 재고율이 40%까지 떨어지며 규제상 최저 기준인 50%를 밑돌게 되어, 가격 급등과 산업 부문공급 제한을 초래했습니다. 유틸리티자들은 여전히 고가인 20년짜리 LNG 계약 체결에 소극적인 태도를 보이고 있으며, 그 결과 공급 리스크 프리미엄이 장기화되어 새로운 액화 플랜트에 대한 투자를 저해하고 있습니다.
부문별 분석
2025년, 파이프라인 천연가스(PNG)는 유럽의 천연가스 시장 점유율 70.7%를 유지했습니다. 이는 MWh당 2-4유로라는 저렴한 요금을 실현한, 수십 년에 걸친 네트워크 구축의 성과를 반영한 것입니다. 그러나 기존 러시아와의 계약이 만료되고 주택의 전기화가 진행됨에 따라 파이프라인 수송량은 감소하고 있으며, PNG에 할당되는 유럽의 천연가스 시장 규모는 축소되고 있습니다. LNG는 MWh당 6-8유로라는 높은 공급 가격을 보이고 있지만, 새로운 FSRU 도입과 유연한 현물 구매 옵션을 통해 2031년까지 연평균 3.5%의 성장세가 예상됩니다.
LNG의 높은 적응성 덕분에, 변동이 심한 재생에너지의 균형을 맞추어야 하는 전력 사업자들에게 가장 선호되는 한계 발전원이 되고 있습니다. 또한, 소규모 LNG는 트럭 운송 및 선박 연료 보급을 뒷받침하며, 하류 부문의 성장을 가속하고 있습니다. 압축 천연가스(CNG)는 여전히 틈새 시장으로 남아 있으며, 주로 이탈리아, 프랑스, 독일에 786곳의 충전소가 있습니다. 경쟁하는 구동 기술의 존재로 인해 CNG의 성장 여지가 제한되고 있으며, 총 수요는 향후 10년 후반에 정점에 달할 것으로 전망됩니다. 전반적으로 볼 때, LNG의 확대는 파이프라인 수송량 감소를 부분적으로 완화하고 있으며, 유럽의 천연가스 시장의 총 수요 감소 속도를 둔화시키고는 있지만, 그 추세를 역전시키기에는 아직 이르지 못하고 있습니다.
기타 혜택 :
- 엑셀 형식 시장 예측(ME) 시트
- 3개월간의 애널리스트 지원
자주 묻는 질문
목차
제1장 서론
제2장 조사 방법
제3장 주요 요약
제4장 시장 구도
제5장 시장 규모 및 성장 예측
제6장 경쟁 구도
제7장 시장 기회 및 향후 전망
KTH 26.06.29According to Mordor Intelligence, the europe natural gas market size is projected to contract from 461.34 Billion cubic meters in 2025 and 453.70 Billion cubic meters in 2026 to 414.5 Billion cubic meters by 2031, registering a CAGR of -1.79% between 2026 to 2031.
This report is Segmented by Type (Compressed Natural Gas, Piped Natural Gas, and Liquefied Natural Gas), Source (Domestic Production - Onshore, Domestic Production - Offshore, and LNG Imports), End-Use Sector (Fertilizer Production, City Gas Distribution, Transportation, Petrochemical Feedstock, and Others), and Geography (Germany, France, Italy, Spain, Netherlands, Norway, Poland, and Rest of Europe).
Europe Natural Gas Market Trends and Insights
Coal-to-Gas Switching in Power & District Heating Fleets
Municipal operators in Germany and Poland continue migrating from aging coal boilers to gas-fired combined heat and power units as carbon-allowance prices climbed to EUR 83.79 per tonne CO2 in December 2025 and are heading toward EUR 149 by 2030. Mid-sized cities favor incremental gas conversions because district-heating grids often lack capacity for large-scale heat pumps. The opportunity window, however, is narrowing as Title Transfer Facility (TTF) prices occasionally exceed coal-switching thresholds, reducing baseload gas economics. While gas-fired electricity output slipped 6% in 2024, near-term compliance deadlines under the Energy Efficiency Directive still support residual switching in heating. As grid upgrades and renewables proliferate, district-heating gas demand is expected to plateau after 2029, reinforcing the European natural gas market's structural decline even as short-term gains persist.
Expansion of European LNG Regasification Capacity
Europe's regasification capacity jumped 32% between 2022 and 2025 to roughly 270 BCM per year, propelled by rapid FSRU deployments in Germany and expansions in Poland and the Netherlands. Germany alone commissioned 44.8 BCM of import capacity across Wilhelmshaven, Brunsbuttel, Lubmin, and Stade within 24 months. Poland's Gdansk FSRU and Swinoujscie upgrade now provide 14.4 BCM combined, giving Warsaw surplus volumes for regional exports. Lithuania's Klaipeda terminal underscores the rise of small-scale reloads, posting 1,834 truck loadings in 2025. Forecast additions could lift capacity to 405 BCM by 2030, implying significant over-build if demand trends hold, so asset owners increasingly seek long-term offtake partners to mitigate utilization risk.
Geopolitical Supply Disruptions After Russia-Ukraine War
Russian pipeline flows plunged from about 40% of EU supply in 2021 to 13% in 2025 as sanctions and the transit-agreement expiry forced diversification. The European Commission now seeks a full Russian-gas ban by the end of 2027, funneling demand to LNG spot markets and Norwegian pipelines. Norway supplied 31% of EU needs in 2025, yet flat output limits future upside. Inventory dipped to 40% in February 2025, below the 50% regulatory minimum, sparking price spikes and industrial curtailments. Utilities remain hesitant to sign 20-year LNG deals at elevated prices, prolonging supply-risk premiums and deterring new liquefaction investments.
Other drivers and restraints analyzed in the detailed report include:
- Policy Support for Gas as a Transition Fuel Under Fit-for-55
- Growth of Small-Scale LNG Bunkering Infrastructure in Baltic & North Seas
- EU 2040 Decarbonization Target Accelerating Electrification
For complete list of drivers and restraints, kindly check the Table Of Contents.
Segment Analysis
Piped natural gas retained 70.7% of the Europe natural gas market share in 2025, reflecting decades of network build-out that offers low tariffs of EUR 2-4 per MWh. Pipeline volumes, however, decline as legacy Russian contracts expire and residential electrification widens, shrinking the European natural gas market size allocated to PNG. LNG, although costlier at EUR 6-8 per MWh delivered, is forecast to expand 3.5% annually through 2031 thanks to new FSRUs and flexible spot-purchase options.
LNG's adaptability makes it the favored marginal source for utilities balancing volatile renewables. Small-scale LNG also supports trucking and marine bunkering, reinforcing downstream growth. Compressed natural gas remains niche, with 786 refueling stations mainly in Italy, France, and Germany. Competing drivetrain technologies restrict CNG's headroom, and total demand is set to plateau late in the decade. Overall, LNG's expansion partially cushions pipeline-volume erosion, slowing, but not reversing, the European natural gas market's aggregate decline.
List of Companies Covered in this Report:
- Shell plc
- BP plc
- TotalEnergies SE
- Equinor ASA
- Eni SpA
- Exxon Mobil Corp.
- Chevron Corp.
- ConocoPhillips
- Engie SA
- EDF SA
- Gazprom PJSC
- OMV AG
- Repsol SA
- PGNiG (PKN Orlen)
- Naturgy Energy Group SA
- VNG AG
Additional Benefits:
- The market estimate (ME) sheet in Excel format
- 3 months of analyst support
TABLE OF CONTENTS
1 Introduction
- 1.1 Study Assumptions & Market Definition
- 1.2 Scope of the Study
2 Research Methodology
3 Executive Summary
4 Market Landscape
- 4.1 Market Overview
- 4.2 Market Drivers
- 4.2.1 Coal-to-gas switching in power & district-heating fleets
- 4.2.2 Expansion of European LNG regasification capacity
- 4.2.3 Policy support for gas as a transition fuel under Fit-for-55
- 4.2.4 Growth of small-scale LNG bunkering infrastructure in Baltic & North Seas
- 4.2.5 Hydrogen-ready pipeline retrofits lowering stranded-asset risk
- 4.3 Market Restraints
- 4.3.1 Geopolitical supply disruptions after Russia-Ukraine war
- 4.3.2 EU 2040 decarbonisation target accelerating electrification
- 4.3.3 Mandatory biomethane blending quotas reducing fossil-gas demand
- 4.4 Supply-Chain Analysis
- 4.5 Regulatory Landscape
- 4.6 Technological Outlook
- 4.7 Porter's Five Forces
- 4.7.1 Bargaining Power of Suppliers
- 4.7.2 Bargaining Power of Consumers
- 4.7.3 Threat of New Entrants
- 4.7.4 Threat of Substitutes
- 4.7.5 Intensity of Rivalry
5 Market Size & Growth Forecasts
- 5.1 By Type
- 5.1.1 Compressed Natural Gas (CNG)
- 5.1.2 Piped Natural Gas (PNG)
- 5.1.3 Liquefied Natural Gas (LNG)
- 5.2 By Source
- 5.2.1 Domestic Production - Onshore
- 5.2.2 Domestic Production - Offshore
- 5.2.3 LNG Imports
- 5.3 By End-Use Sector
- 5.3.1 Fertilizer Production
- 5.3.2 City Gas Distribution
- 5.3.3 Transportation
- 5.3.4 Petrochemical Feedstock
- 5.3.5 Others [Industrial Manufacturing, Agriculture (Tea Plantation), IC for Pipeline System, LPG Shrinkage, Sponge Iron/Steel]
- 5.4 By Geography
- 5.4.1 Germany
- 5.4.2 France
- 5.4.3 Italy
- 5.4.4 Spain
- 5.4.5 Netherlands
- 5.4.6 Norway
- 5.4.7 Poland
- 5.4.8 Rest of Europe
6 Competitive Landscape
- 6.1 Market Concentration
- 6.2 Strategic Moves (M&A, Partnerships, PPAs)
- 6.3 Market Share Analysis (Market Rank/Share for key companies)
- 6.4 Company Profiles (includes Global level Overview, Market level overview, Core Segments, Financials as available, Strategic Information, Products & Services, and Recent Developments)
- 6.4.1 Shell plc
- 6.4.2 BP plc
- 6.4.3 TotalEnergies SE
- 6.4.4 Equinor ASA
- 6.4.5 Eni SpA
- 6.4.6 Exxon Mobil Corp.
- 6.4.7 Chevron Corp.
- 6.4.8 ConocoPhillips
- 6.4.9 Engie SA
- 6.4.10 EDF SA
- 6.4.11 Gazprom PJSC
- 6.4.12 OMV AG
- 6.4.13 Repsol SA
- 6.4.14 PGNiG (PKN Orlen)
- 6.4.15 Naturgy Energy Group SA
- 6.4.16 VNG AG
7 Market Opportunities & Future Outlook
- 7.1 White-space & Unmet-Need Assessment