

|
시장보고서
상품코드
2073206
미국의 폐기물 유래 재생 가스 시장 : 점유율 분석, 업계 동향과 통계, 성장 예측(2026-2031년)United States Renewable Gas From Waste - Market Share Analysis, Industry Trends & Statistics, Growth Forecasts (2026 - 2031) |
||||||
 Mordor Intelligence
Mordor Intelligence에 의하면, 미국 폐기물 유래 재생 가스 시장 규모는 2025년에 48억 2,000만 달러, 2026년에 52억 9,000만 달러되어, 2031년까지 89억 8,000만 달러에 이를 것으로 예측되며, 2026년부터 2031년까지 CAGR 11.16%로 성장할 전망입니다.
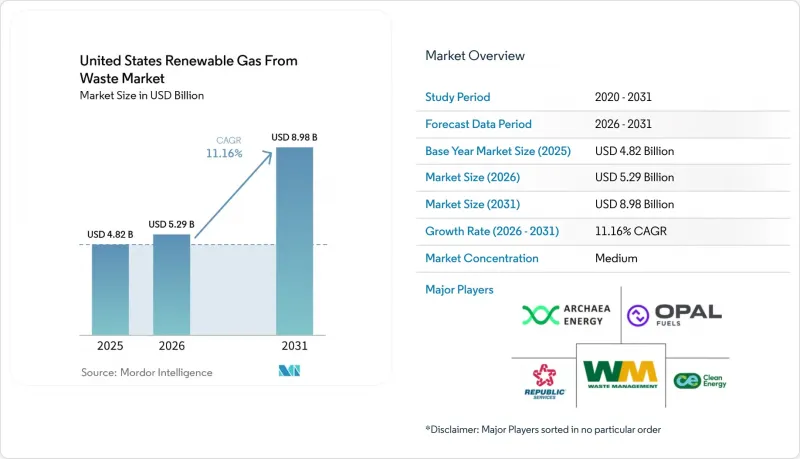
본 보고서는 원료(도시 고형 폐기물, 가축 분뇨, 식품 폐기물 등), 기술(가스화, 열분해 등), 가스 유형(바이오가스, 합성가스 등), 용도(발전, 계통 연계 등), 구성 요소(가스 회수, 소화조·발효 등)별로 분류되어 있습니다. 시장 전망은 금액(달러) 기준으로 제시되어 있습니다.
미국 폐기물 유래 재생 가스 시장 동향 및 인사이트
IRA 세액 공제가 대규모 자본 투자를 촉진
인플레이션 억제법(IRA) 제45Z조에 따른 청정 연료 생산 세액 공제는 미국 내 폐기물 유래 재생 가스 시장에서 프로젝트 파이낸싱의 가장 큰 원동력이 되고 있습니다. 기존의 생산량 기반 제도와는 달리, 제45Z조에서는 세액 공제액이 수명 주기 전반에 걸친 탄소 집약도와 연동되어 있으므로, 젖소의 분뇨나 식품 폐기물을 원료로 사용하는 공정은 탄소 배출량이 많은 원료에 비해 뚜렷한 경제적 우위를 갖습니다. “One Big Beautiful Bill Act”에 따라 이 세액 공제 혜택이 2029년까지 연장됨에 따라, 개발부터 가동까지 5-7년이 소요되는 프로젝트의 자금 조달 가능성이 크게 개선되었습니다. 또한, 2026년 2월 미국 재무부 및 국세청(IRS)이 제안한 규제안에서 파이프라인 등급의 바이오메탄으로 정제된 바이오가스도 세액 공제 대상이 됨이 확인되어, 시장 내 자금 조달의 가장 큰 불확실성 중 하나가 해소되었습니다. 크레딧의 양도 가능성 덕분에 이러한 크레딧의 구매자층이 확대되었습니다. 이러한 효과는 2025년에 뚜렷이 나타나, 40개의 신규 농장 기반 시스템과 20개의 신규 매립지 가스 시스템이 가동을 시작했으며, 총 투자액은 17억 5,000만 달러에 달했습니다.
연방 RFS RIN 크레딧이 RNG 프로젝트의 경제성을 향상시킵니다.
재생 가능 연료 기준(RFS)은 미국 내 폐기물 유래 재생 가스 시장의 주요 수익원으로 자리 잡고 있으며, 2026년 3월의 최종 규정에서는 적용 대상인 셀룰로오스계 바이오연료의 총량이 2026년에는 13억 6,000만 RIN, 2027년에는 14억 3,000만 RIN으로 설정되었습니다. 해당 규정에 따라 eRIN이 프로그램에서 제외되면서 규정 준수 경로가 좁아졌고, 주로 RNG 프로젝트를 통해 생성되는 D3 셀룰로오스계 RIN에 대한 수요가 집중되게 되었습니다. 또한, “바이오가스 규제 개혁 규칙”에 따라, 40 CFR Part 80 Subpart E에 근거한 운송용 연료 실증 요건에서 RNG의 RIN 생성을 분리함으로써, 규정 준수 관련 마찰이 완화되었습니다. 시장 수요는 이러한 틀에 발맞추어 변화하고 있으며, 2025년 미국에서 소비된 도로용 천연가스 차량 연료의 94%가 RNG였으며, 총 소비량 8억 600만 GGE 중 7억 5,500만 GGE를 차지했습니다. 또한, RNG 자동차 연료 사용량은 전년 대비 13% 증가했습니다. 이러한 규제의 명확성과 검증된 연료 소비량이 결합됨에 따라, 미국의 폐기물 유래 재생 가스 시장에서 기관 투자자들에게 매력적인 수준의 프로젝트 수익성이 지속적으로 뒷받침되고 있습니다.
RFS의 변동성과 LCFS 크레딧 가격 하락이 수익 전망에 부정적인 영향을 미치고 있습니다.
미국 폐기물 유래 재생 가스 시장의 많은 프로젝트는 여전히 연방 RIN 및 캘리포니아주의 LCFS 크레딧을 중심으로 한 복합적인 수익 모델에 의존하고 있어, 수익 전망은 정책이나 가격 변동의 영향을 받기 쉽습니다. 2026년 4월의 최종 규정에서는 생산량이 목표를 하회함에 따라, 2025년 셀룰로오스계 바이오연료 할당량이 13억 8,000만 RIN에서 12억 1,000만 RIN으로 부분적으로 하향 조정되었습니다. 이는 공급량이 예상치를 밑돌 경우, EPA가 할당량을 감축할 의향이 있음을 나타냅니다. LCFS 측면에서는 2025년 하반기 2분기 연속 순부족이 발생했으나, 연간 평균 크레딧 가격은 1메트르톤당 57달러에 그쳐 2024년 평균인 60달러를 밑돌았습니다. 이러한 괴리는 2025년 말 기준으로 3,969만 메트르톤의 크레딧 뱅크가 과잉 축적되어 있음을 반영하며, 메트르톤당 100달러를 초과하는 LCFS 가치를 기준으로 자금을 조달한 프로젝트에는 상당한 수익 격차가 발생하고 있습니다. 수익 전망은 제45Z조에 따른 잠정 배출률 산정 절차의 영향도 받고 있으며, 이로 인해 은행 대출 자격을 충족하는 탄소 집약도 점수를 아직 획득하지 못한 공동 소각 프로젝트의 평가가 지연되고 있습니다.
부문별 분석
2025년, 도시 고형 폐기물은 미국 폐기물 유래 재생 가스 시장 점유율의 39.2%를 차지했습니다. 이는 미국 전역에서 수년에 걸쳐 확립되어 온 매립지 가스 회수 시스템의 도입 실적을 반영한 것입니다. 미국 바이오가스 협의회(American Biogas Council)의 집계에 따르면, 599곳의 매립지 가스 시설이 연간 5,590억 입방피트를 생산하고 있으며, 매립지 바이오가스 투자액은 2023년과 2024년 양해 모두 연간 10억 달러를 넘어섰습니다. 식품 폐기물은 가장 빠르게 성장하고 있는 원료로, 2026년부터 2031년까지 연평균 성장률(CAGR) 13.8%를 나타낼 것으로 전망됩니다. 이는 2024년부터 2025년까지 식품 폐기물 전용 소화 시설에 대한 투자액이 3억 2,500만 달러로 거의 3배 증가한 점과, 2025년 바이오가스 회수량이 18% 증가해 280억 입방피트에 달한 점이 배경으로 작용했습니다. 이러한 경향은 유기물 매립을 피하려는 움직임이 확대되고 성장의 중심이 보다 분산형 원료로 이동하고 있음에도 불구하고, 미국의 폐기물 유래 재생 가스 시장이 여전히 성숙한 매립 시설에 의해 지탱되고 있음을 보여줍니다.
가축 분뇨, 특히 젖소와 돼지의 배설물은 탄소 강도가 낮을수록 섹션 45Z에 따른 세액 공제액이 커지기 때문에 급속히 증가하고 있습니다. 하수 슬러지는 여전히 대규모로 널리 확보 가능한 원료이며, 1,240곳 이상의 수자원 회수 시설에서 혐기성 소화 설비가 가동되고 있지만, 지자체의 조달 주기와 인프라 노후화로 인해 신규 건설 속도는 둔화되고 있습니다. 식품 가공 및 음료 제조 분야에서는 원료 공급이 예측 가능하기 때문에 산업계 유기 폐기물의 중요성이 커지고 있습니다. 동시에, 470곳 이상의 가동 중인 매립지에서는 이론상 회수 및 정제가 가능한 가스가 여전히 플레어링되고 있어, 미국의 폐기물 유래 재생 가스 시장에는 측정 가능한 프로젝트 파이프라인이 남아 있습니다.
혐기성 소화는 2025년에 41.8%의 점유율을 차지하고, 가축 분뇨, 식품 폐기물, 하수 슬러지, 산업계 유기물에서 그 유효성이 입증되었기 때문에 여전히 주요 기술로서의 위상을 유지하고 있습니다. 이러한 우위는 프로젝트 설계에 있어 큰 전환과 밀접한 관련이 있으며, 농업을 기반으로 한 혐기성 소화 방식을 이용한 RNG(재생 가능 천연가스) 시설은 2020년 90곳에서 2025년에는 414곳으로 증가하여, 5년 동안 360%의 성장률을 기록했습니다. 바이오가스 정제 시스템은 가장 빠르게 성장하고 있는 기술 분야로, 2026년부터 2031년까지 연평균 성장률(CAGR) 12.3%를 나타낼 것으로 전망됩니다. 이러한 정제 기술의 가속화는 2024년 이후 미국의 신규 바이오가스 프로젝트 중 95%가 현장 발전이 아닌 RNG 생산을 목적으로 설계되었다는 사실과 일치합니다.
매립가스 회수는 여전히 기술 구성에서 큰 비중을 차지하고 있습니다. 이는 연방 배출 규제가 대규모 매립지에서의 회수를 지원하고 있는 데다, 2023년부터 2025년까지 일리노이주가 매립가스 처리 능력을 가장 많이 확충했기 때문입니다. 가스화 및 열분해는 미국 폐기물 유래 재생 가스 시장에서 여전히 규모는 작지만, 발전 가능성이 있는 대안으로 주목받고 있습니다. 특히, 기존의 소화 처리 방식으로는 바이오메탄 수율이 낮아지는 도시 고형 폐기물 및 농업 잔여물 분야에서 그 활용이 확대되고 있습니다. 정책 지원이 확대되고, 개발자들이 처리하기 어려운 원료를 수익화할 수 있는 더 나은 방법을 모색함에 따라, 이러한 열화학적 공정은 발전 분야에서 주목을 받고 있습니다. 또한, 업그레이드 및 가스 공급 단계에서 품질 기준을 준수하는 것도 중요하기 때문에 ASTM D8452 및 관련 가스 품질 기준이 상업시설의 기술 선정에 계속해서 영향을 미치고 있습니다.
기타 혜택:
- 엑셀 형식 시장 예측(ME) 시트
- 3개월간의 애널리스트 지원
자주 묻는 질문
목차
제1장 서론
제2장 조사 방법
제3장 주요 요약
제4장 시장 구도
제5장 시장 규모와 성장 예측
제6장 경쟁 구도
제7장 시장 기회와 향후 전망
JHS 26.07.07According to Mordor Intelligence, the united states renewable gas from waste market size is projected to be USD 4.82 billion in 2025, USD 5.29 billion in 2026, and reach USD 8.98 billion by 2031, growing at a CAGR of 11.16% from 2026 to 2031.
This report is Segmented by Feedstock (Municipal Solid Waste, Animal Manure, Food Waste, and More), by Technology (Gasification, Pyrolysis, and More), by Gas Type (Biogas, Syngas, and More), by Application (Electricity Generation, Grid Injection, and More), and by Component (Gas Collection, Digesters & Fermentation, and More). The Market Forecasts are Provided in Terms of Value (USD).
United States Renewable Gas From Waste Market Trends and Insights
IRA Tax Credits Catalyzing Large-Scale Capital Deployment
The Inflation Reduction Act's Section 45Z clean fuel production credit has become the strongest project finance catalyst in the United States renewable gas from waste market. Unlike older volume-based structures, Section 45Z ties credit value to lifecycle carbon intensity, giving dairy manure and food waste pathways a clear economic edge over higher-carbon feedstocks. The One Big Beautiful Bill Act extended the credit through 2029, materially improving the bankability of projects that require 5 to 7 years from development to operation. The February 2026 proposed regulations from the United States Treasury and IRS also confirmed that biogas upgraded to pipeline-quality biomethane qualifies for the credit, removing one of the biggest financing uncertainties in the market. Transferability has widened the buyer pool for these credits, and this effect was evident in 2025, when 40 new farm-based systems and 20 new landfill gas systems came online, totaling a combined capital of USD 1.75 billion.
Federal RFS RIN Credits Boosting RNG Project Economics
The Renewable Fuel Standard remains the primary revenue stream for the United States renewable gas from waste market, and the March 2026 final rule set total applicable cellulosic biofuel volumes at 1.36 billion RINs for 2026 and 1.43 billion RINs for 2027. The same rule removed eRINs from the program, narrowing the compliance pathway and concentrating demand on D3 cellulosic RINs generated largely by RNG projects. The Biogas Regulatory Reform Rule also reduced compliance friction by decoupling RNG RIN generation from transportation fuel demonstration requirements under 40 CFR Part 80 Subpart E. Market demand has kept pace with that framework because 94% of all on-road natural gas vehicle fuel consumed in the United States in 2025 was RNG, equal to 755 million GGE out of 806 million GGE total, while RNG motor fuel use rose 13% year over year. This combination of regulatory clarity and verified fuel consumption continues to support project returns at levels that remain attractive to institutional capital in the United States renewable gas from waste market.
RFS Volatility and Declining LCFS Credit Prices Hurting Revenue Visibility
Many projects in the United States renewable gas from waste market still rely on a stacked revenue model built around federal RINs and California LCFS credits, which makes revenue forecasts sensitive to policy and pricing changes. The April 2026 final rule partially waived the 2025 cellulosic biofuel volume from 1.38 billion RINs to 1.21 billion RINs because production fell short, which showed that the EPA is willing to reduce obligations when supply does not meet expectations. On the LCFS side, the second half of 2025 produced two net-deficit quarters, yet the annual average credit price remained at USD 57 per metric ton, below the 2024 average of USD 60. That disconnect reflects the overhang from a 39.69 million metric ton credit bank at the end of 2025, leaving a meaningful revenue gap for projects underwritten at LCFS values above USD 100 per metric ton. Revenue visibility is further affected by the provisional emissions rate process under Section 45Z, which slows appraisal for co-digestion projects that still need a bankable carbon intensity score.
Other drivers and restraints analyzed in the detailed report include:
- California LCFS Rewarding Negative Carbon Intensity Feedstocks
- Corporate Fleet Decarbonization Driving Long-Term RNG Offtake
- Federal Policy Uncertainty Stalling Final Investment Decisions
For complete list of drivers and restraints, kindly check the Table Of Contents.
Segment Analysis
Municipal Solid Waste accounted for 39.2% of the United States renewable gas from waste market share in 2025, reflecting the long-established installed base of landfill gas capture systems across the country. The American Biogas Council counted 599 landfill gas facilities producing 559 billion cubic feet per year, and landfill biogas investment exceeded USD 1 billion annually in both 2023 and 2024. Food waste is the fastest-growing feedstock, with a forecast CAGR of 13.8% from 2026 to 2031, supported by a near tripling of investment in food waste-only digestion facilities between 2024 and 2025 to USD 325 million and an 18% rise in biogas capture to 28 billion cubic feet in 2025. This pattern shows that the United States renewable gas from waste market is still anchored by mature landfill assets even as organics diversion is shifting the growth center toward more distributed feedstocks.
Animal manure, especially dairy and swine waste, has grown rapidly because lower carbon-intensity scores translate into greater tax credit value under Section 45Z. Sewage sludge remains a large and widely available feedstock, with more than 1,240 water resource recovery facilities operating anaerobic digesters, although municipal procurement cycles and aging infrastructure slow new-build activity. Industrial organic waste is becoming more relevant in food processing and beverage operations, where feedstock supply is predictable. At the same time, more than 470 active landfills still flare gas that could, in theory, be captured and upgraded, leaving a measurable project pipeline for the United States renewable gas from waste market.
Anaerobic digestion held 41.8% share in 2025 and remains the lead technology because it is proven across manure, food waste, wastewater sludge, and industrial organics. That lead is tied to a major project design shift, as farm-based anaerobic digestion RNG facilities increased from 90 in 2020 to 414 in 2025, representing 360% growth in five years. Biogas upgrading systems are the fastest-growing technology segment, with a forecast CAGR of 12.3% from 2026 to 2031. The acceleration in upgrading is consistent with the fact that 95% of new United States biogas projects since 2024 have been designed for RNG production rather than onsite power generation.
Landfill gas recovery still accounts for a large share of the technology mix because federal emissions rules support capture at larger landfill sites, and Illinois added the most new landfill gas capacity from 2023 to 2025. Gasification and pyrolysis remain smaller but developing options in the United States renewable gas from waste market, especially for municipal solid waste and agricultural residues, where conventional digestion can deliver lower biomethane yield. These thermochemical routes are attracting attention for electricity generation as policy support broadens and developers seek better ways to monetize harder-to-digest feedstocks. Quality compliance also matters at the point of upgrading and injection, so ASTM D8452 and related gas quality standards continue to shape technology selection at commercial sites.
Complete Report Scope:
- By Feedstock
- Municipal Solid Waste (MSW)
- Agricultural Residues
- Animal Manure
- Industrial Organic Waste
- Sewage Sludge
- Food Waste
- Others
- By Technology
- Anaerobic Digestion
- Landfill Gas Recovery
- Gasification
- Pyrolysis
- Biogas Upgrading Systems
- Others
- By Gas Type
- Biogas
- Biomethane / Renewable Natural Gas (RNG)
- Syngas
- By Application
- Electricity Generation
- Combined Heat & Power (CHP)
- Grid Injection
- Transportation Fuel
- Industrial Heating
- Residential & Commercial Heating
- Others
- By Component
- Gas Collection Systems
- Digesters & Fermentation Systems
- Gas Processing & Upgrading Units
- Compressors & Storage Systems
- Power Generation Equipment
- Monitoring & Control Systems
- Others
List of Companies Covered in this Report:
- Archaea Energy
- Clean Energy Fuels Corp.
- Waste Management Inc.
- Republic Services
- OPAL Fuels
- Ameresco
- Vanguard Renewables
- Aemetis Biogas
- Montauk Renewables
- Brightmark
- Chesapeake Utilities Corporation
- Fortistar
- Amp Americas
- Rumpke Consolidated Companies
- GFL Environmental
- Reworld
- Kinder Morgan
- TotalEnergies
- DTE Vantage
- Morrow Renewables
Additional Benefits:
- The market estimate (ME) sheet in Excel format
- 3 months of analyst support
TABLE OF CONTENTS
1 Introduction
- 1.1 Study Assumptions & Market Definition
- 1.2 Scope of the Study
2 Research Methodology
3 Executive Summary
4 Market Landscape
- 4.1 Market Overview
- 4.2 Market Drivers
- 4.2.1 IRA Tax Credits Catalyzing Large-Scale Capital Deployment
- 4.2.2 Federal RFS RIN Credits Boosting RNG Project Economics
- 4.2.3 California LCFS Rewarding Negative Carbon Intensity Feedstocks
- 4.2.4 Corporate Fleet Decarbonization Driving Long-Term RNG Offtake
- 4.2.5 State Organics Diversion Mandates Expanding Feedstock Availability
- 4.2.6 AI-Driven Electricity Demand Strengthening Dispatchable Biogas Value
- 4.3 Market Restraints
- 4.3.1 RFS Volatility and Declining LCFS Credit Prices Hurting Revenue Visibility
- 4.3.2 Federal Policy Uncertainty Stalling Final Investment Decisions
- 4.3.3 Pipeline Interconnection Backlogs Delaying RNG Project Commissioning
- 4.3.4 Geographic Feedstock Dispersal Limiting Viable Economic-Scale Sites
- 4.4 Value / Supply-Chain Analysis
- 4.5 Regulatory Landscape
- 4.6 Technological Outlook
- 4.7 Porter's Five Forces
- 4.7.1 Threat of New Entrants
- 4.7.2 Bargaining Power of Suppliers
- 4.7.3 Bargaining Power of Buyers
- 4.7.4 Threat of Substitutes
- 4.7.5 Industry Rivalry
- 4.8 Digital Feedstock Management and Process Optimization Improving Renewable Gas Plant Efficiency
- 4.9 Organic Waste Diversion and Segregation Policies Supporting Feedstock Supply Growth
- 4.10 Impact of Geopolitical Events on the Market
5 Market Size & Growth Forecasts
- 5.1 By Feedstock
- 5.1.1 Municipal Solid Waste (MSW)
- 5.1.2 Agricultural Residues
- 5.1.3 Animal Manure
- 5.1.4 Industrial Organic Waste
- 5.1.5 Sewage Sludge
- 5.1.6 Food Waste
- 5.1.7 Others
- 5.2 By Technology
- 5.2.1 Anaerobic Digestion
- 5.2.2 Landfill Gas Recovery
- 5.2.3 Gasification
- 5.2.4 Pyrolysis
- 5.2.5 Biogas Upgrading Systems
- 5.2.6 Others
- 5.3 By Gas Type
- 5.3.1 Biogas
- 5.3.2 Biomethane / Renewable Natural Gas (RNG)
- 5.3.3 Syngas
- 5.4 By Application
- 5.4.1 Electricity Generation
- 5.4.2 Combined Heat & Power (CHP)
- 5.4.3 Grid Injection
- 5.4.4 Transportation Fuel
- 5.4.5 Industrial Heating
- 5.4.6 Residential & Commercial Heating
- 5.4.7 Others
- 5.5 By Component
- 5.5.1 Gas Collection Systems
- 5.5.2 Digesters & Fermentation Systems
- 5.5.3 Gas Processing & Upgrading Units
- 5.5.4 Compressors & Storage Systems
- 5.5.5 Power Generation Equipment
- 5.5.6 Monitoring & Control Systems
- 5.5.7 Others
6 Competitive Landscape
- 6.1 Market Concentration
- 6.2 Strategic Moves
- 6.3 Market Share Analysis
- 6.4 Company Profiles (Includes Global Level Overview, Market Level Overview, Core Segments, Financials as Available, Strategic Information, Products & Services, and Recent Developments)
- 6.4.1 Archaea Energy
- 6.4.2 Clean Energy Fuels Corp.
- 6.4.3 Waste Management Inc.
- 6.4.4 Republic Services
- 6.4.5 OPAL Fuels
- 6.4.6 Ameresco
- 6.4.7 Vanguard Renewables
- 6.4.8 Aemetis Biogas
- 6.4.9 Montauk Renewables
- 6.4.10 Brightmark
- 6.4.11 Chesapeake Utilities Corporation
- 6.4.12 Fortistar
- 6.4.13 Amp Americas
- 6.4.14 Rumpke Consolidated Companies
- 6.4.15 GFL Environmental
- 6.4.16 Reworld
- 6.4.17 Kinder Morgan
- 6.4.18 TotalEnergies
- 6.4.19 DTE Vantage
- 6.4.20 Morrow Renewables
7 Market Opportunities & Future Outlook
- 7.1 White-space & Unmet-Need Assessment


