

|
시장보고서
상품코드
2073247
폐기물 유래 재생 가스 : 시장 점유율 분석, 업계 동향 및 통계, 성장 예측(2026-2031년)Renewable Gas From Waste - Market Share Analysis, Industry Trends & Statistics, Growth Forecasts (2026 - 2031) |
||||||
 Mordor Intelligence
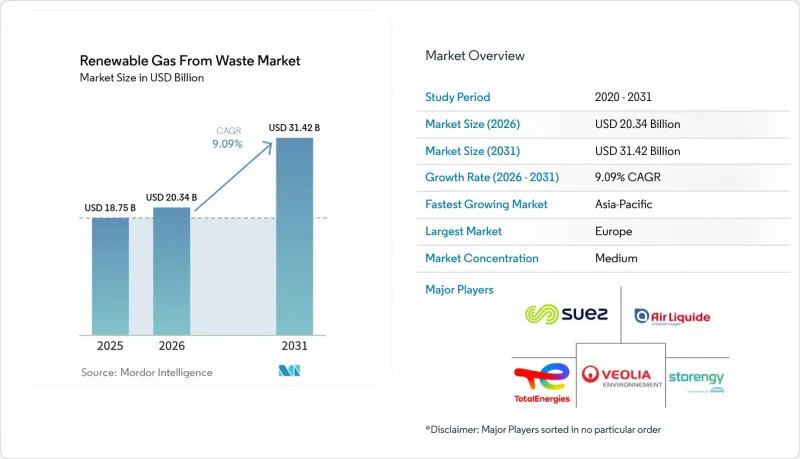
Mordor Intelligence에 의하면, 폐기물 유래 재생 가스 시장 규모는 2025년에 187억 5,000만 달러로 평가되었습니다. 2026년 203억 4,000만 달러에서 2031년까지 314억 2,000만 달러에 이를 것으로 예상되며, 예측 기간(2026-2031년) CAGR은 9.09%를 나타낼 전망입니다.
본 보고서는 원료별(식품 폐기물, 가축 분뇨 등), 기술별(가스화, 열분해 등), 가스 유형별(바이오가스, 합성가스 등), 용도별(발전 등), 구성 요소별(가스 회수, 소화조·발효 등) 및 지역별(북미, 유럽 등)로 분류되어 있습니다. 시장 전망은 금액(달러) 기준으로 제시되어 있습니다.
세계의 폐기물 유래 재생 가스 시장 동향 및 인사이트
RFS, LCFS, 바이오메탄 요금 제도 등 정부의 인센티브가 늘어나고 있습니다.
정부의 정책은 폐기물 유래 재생 가스 시장에 대한 가장 명확한 상업적 지원이며, 개발자에게 대출 기관이 보장할 수 있는 수익 기반을 제공합니다. 미국 환경보호청(EPA)은 2026년 3월에 '제2차 재생 가능 연료 기준(RFS)' 규정을 최종 확정하고, 셀룰로오스계 바이오연료의 의무 할당량을 2026년에는 13억 6,000만 재생 가능 식별 번호(RIN), 2027년에는 14억 3,000만 RIN으로 설정했습니다. 이에 따라 규제상의 초점은 여전히 바이오가스 유래 경로에 맞추어져 있습니다. 이 결정이 중요한 이유는 재생 가능 전력이 대상량에서 제외됨에 따라 D3 재생 가능 식별 번호에 대한 수요가 매립지 가스 및 혐기성 소화 방식을 통한 RNG 프로젝트에 더욱 집중될 것이기 때문입니다. 또한 캘리포니아주에서는 2025년 7월 1일에 개정된 저탄소 연료 기준(LCFS) 규정이 시행됨에 따라, 전기차 충전을 위한 직렬 발전기에 사용되는 바이오메탄에 대한 '북 앤 클레임' 회계 기간이 2035년까지 연장됨에 따라 프로젝트의 가시성이 한층 더 높아졌습니다. 유럽에서는 “REPowerEU” 2030년을 목표로 한 연간 35 bcm의 바이오메탄 목표를 지속적으로 지원하고 있으며, 유럽집행위원회는 누적 투자 수요를 370억 유로(400억 달러)로 추산하고 있습니다. 이에 따라 폐기물 유래 재생 가스 시장은 대규모 공공 정책에 따른 확대 계획과 계속해서 보조를 맞추고 있습니다.
엄격한 메탄 배출 규제와 매립가스 이용 의무화가 LFG(매립가스)를 에너지로 전환하는 프로젝트를 추진
메탄 규제로 인해 매립가스 회수는 단순한 자발적인 환경 대책에서 폐기물 유래 재생 가스 시장에서의 직접적인 투자 계기로 변화하고 있습니다. 미국 환경보호청(EPA)의 온실가스 보고 프로그램에 따르면, 2023년에는 1,287곳의 도시 고형 폐기물 및 산업 폐기물 매립지가 추적 조사 대상에 포함되었으며, 이 중 83%의 시설에서는 여전히 폐기물 반입이 활발히 이루어지고 있어, 향후 규정 준수 활동을 위한 대규모 모니터링 대상이 남아 있습니다. 미국 바이오가스 협의회(American Biogas Council)의 보고서에 따르면, 미국 내 470곳의 매립지에서 본래라면 RNG(재생 가능 천연가스)로 전환될 수 있는 가스가 여전히 플레어링(연소 처리)되고 있으며, 이는 132만 2,000 scfm에 해당하는 미활용 회수 잠재력을 보여줍니다. 회수 규제가 강화됨에 따라, 회수된 가스는 수송망이나 전력망에 연결됨으로써 더 높은 가치를 갖게 되므로, 단순한 플레어링이나 직접 연소보다는 RNG로의 업그레이드를 선호하는 사업자가 늘어날 것으로 보입니다.
LFG 시스템, 플랜트 업그레이드 및 파이프라인 연결에는 막대한 설비 투자가 필요합니다.
자본 집약성은 폐기물 유래 재생 가스 시장에서 여전히 주요 장벽으로 남아 있으며, 특히 새로운 회수 시스템, 가스 정화 설비 및 파이프라인 연결이 필요한 프로젝트에서 두드러지게 나타납니다. 미국 바이오가스 협의회(U.S. Biogas Council)의 추산에 따르면, 미국의 바이오가스 회수 잠재력을 완전히 끌어내기 위해서는 대상 매립지, 식품 폐기물 처리 시설, 농장 및 하수 처리 시설 전체에 걸쳐 4,500억 달러의 자본이 필요할 것으로 예측됩니다. 바로 이러한 규모의 지출이 있기 때문에 개발업체들은 기존 인프라가 잘 갖춰진 곳, 탄소 크레딧의 경제성이 더 높은 곳, 혹은 장기적인 임베디드 계약이 체결된 곳에 계속해서 주력하고 있는 것입니다. 또한, 파이프라인 간의 상호 연결 역시 불확실성을 높이는 요인이 되고 있습니다. 비용은 네트워크와의 거리, 공공용 가스의 사양, 계량 요건에 따라 변동하기 때문에 입지 선정은 초기 단계부터 재무상의 과제가 됩니다. 이러한 자금 조달 부담이 폐기물 유래 재생 가스 시장의 프로젝트 착수를 지연시키고 있으며, 특히 충분한 재무 기반이나 포트폴리오 파트너를 보유하지 않은 독립 개발업체들에게는 심각한 문제가 되고 있습니다.
부문별 분석
2025년에는 도시 고형 폐기물이 35.4%로 가장 큰 비중을 차지하며, 폐기물 유래 재생 가스 시장의 도입된 원료 공급의 핵심으로 자리매김했습니다. 이 지위는 규제된 매립 인프라, 성숙한 폐기물 셀에서 예상 가능한 가스 생산량, 그리고 미국 RFS(재생 가능 연료 기준)에 기반한 D3 재생 가능 식별 번호(RIN) 생성을 뒷받침하는 셀룰로오스계 원료로서의 인증이라는 세 가지 지속 가능한 경쟁 우위를 통해 달성되었습니다. 매립 프로젝트는 북미와 유럽에서의 오랜 운영 실적을 바탕으로 한 이점도 누리고 있으며, 이로 인해 금융 기관과 개발 사업자는 비교적 새로운 폐기물 처리 방식에 비해 이를 평가하기가 더 수월해졌습니다. 식품 폐기물은 가장 빠르게 성장하고 있는 원료 부문으로, 2026년부터 2031년까지 연평균 성장률(CAGR) 10.2%로 확대될 것으로 전망됩니다. 이는 각 주에서 시행하는 유기물 폐기 금지 조치와, 수분 함량이 높은 유기물을 혐기성 소화 공정에 투입하는 것이 경제적으로 유리하다는 점을 반영한 것입니다. 미국 바이오가스 협의회는 2026년 2월, 식품 폐기물이 미국의 일반 도시 고형 폐기물의 15%를 차지했으며, 그중 75% 이상이 여전히 매립지로 보내지고 있기 때문에 향후 다른 용도로 활용할 수 있는 양이 대량으로 남아 있다고 밝혔습니다.
해당 보고서에 따르면, 미국 내 식품 폐기물 전용 혐기성 소화 시설은 불과 124곳에 불과하며, 연간 총 처리 능력은 27.6 Bcf에 그치고 있어, 이론상의 잠재 능력인 192 Bcf와 비교할 때 이 분야가 자원 기반에 비해 얼마나 초기 단계에 있는지가 여실히 드러나고 있습니다. 농업 잔여물과 가축 분뇨는 폐기물 유래 재생 가스(RNG) 산업에서 독자적인 가치 원천이 되고 있습니다. 이는 낙농 분뇨가 LCFS(생명주기 탄소 기준) 및 연방 RFS(재생 가능 연료 기준)에 따라 매우 유리한 생명주기 탄소 점수를 획득할 수 있기 때문입니다. 이러한 수익이 누적되어 탄소 강도가 충분히 낮고, 가스의 가치를 훨씬 능가하는 부가가치를 창출할 수 있는 경우, 분뇨 유래 RNG는 특히 매력적인 선택지가 됩니다. 또한, 식품 가공업체, 양조업체, 제약 공장이 "게이트 수수료" 그 작동 원리와 장기적인 에너지 조달을 결합할 수 있기 때문에 산업계 유기 폐기물도 그 중요성이 커지고 있습니다. 유엔 식량농업기구(FAO)와 경제협력개발기구(OECD)가 제시한 2025년부터 2034년까지의 전망은 이러한 원료 구성의 장기적인 방향성을 뒷받침하고 있습니다. 중소득 국가에서 소득 증가와 도시화로 인해 시간이 지남에 따라 식품 소비량 및 관련 폐기물량이 증가할 것으로 예상되기 때문입니다.
2025년 기준으로, 혐기성 소화는 기술 구성의 44.1%를 차지하며, 폐기물 유래 재생 가스 시장에서 가장 큰 기반을 형성했습니다. 이러한 우위는 폭넓은 원료 대응 능력에서 비롯됩니다. 동일한 공정군이 하수 슬러지, 식품 폐기물, 가축 분뇨, 혼합 유기물 등에 대응할 수 있으며, 새로운 대체 기술에 비해 상업적 성숙도가 훨씬 높기 때문입니다. 또한, 혐기성 소화 공정은 오랜 운영 실적이 있다는 점도 장점이며, 이를 통해 대출 측의 불확실성이 줄어들고 표준화된 플랜트 구성이 촉진됩니다. 공동 소화는 사업자가 서로 다른 유기물 유입원을 혼합하여 원료의 계절적 변동을 완화함으로써 이용률을 높일 수 있으므로, 이러한 이점을 더욱 강화합니다. 2025년에 발표된 조사에 따르면, 제로가 철 나노입자, 바이오차, 바이오오거멘테이션 등의 공정 개입을 통해 제어된 조건 하에서 바이오가스 수율과 메탄 함량을 증가시킬 수 있는 것으로 보고되었으며, 이는 기존 시설의 성능이 더욱 향상될 수 있음을 시사하고 있습니다.
매립가스 회수는 규제 대상 부지의 폐기물 관리 인프라에 포함되어 있으므로 여전히 중요합니다. 그러나 유기물의 매립 처분을 금지하는 규정에 따라, 그 장기적인 시장 점유율은 압박을 받을 가능성이 있습니다. 바이오가스 정제는 가장 빠르게 성장하고 있는 기술 분야로, 2031년까지 연평균 성장률(CAGR) 11.1%를 나타낼 것으로 전망됩니다. 이는 운송용 연료나 전력망 공급과 같은 경로를 통해 더 높은 경제성을 얻을 수 있음을 반영한 것입니다. 최근 기술 연구에 따르면, 4컬럼식 진공 압력 스윙 흡착(VPSA) 시스템이나 나노버블 강화형 막 기술 등 새로운 정제 설계를 통해 에너지 소비량 감소와 가스 순도 향상이 기대되고 있습니다. 메탄 순도 향상과 처리 에너지 절감은 폐기물 유래 재생 가스 시장에서 플랜트의 이익률을 직접적으로 높여주므로, 이러한 개선은 중요합니다. 가스화 및 열분해도 여전히 시장의 한 부분을 차지하고 있습니다. 그러나 이러한 기술들은 상업적 기반이 작고 적합한 원료의 범위도 제한적이기 때문에 혐기성 소화나 업그레이딩에 비해 여전히 틈새 시장 수준에 머물러 있습니다.
지역별 분석
2025년, 유럽은 폐기물 유래 재생 가스 시장의 38.5%를 차지하며, 현재 주기에서 가장 규모가 큰 지역 시장이 되었습니다. 이 지역의 경쟁력은 바이오메탄 정책의 높은 목표, 확립된 소화 및 정제 설비, 그리고 여러 회원국에 걸친 광범위한 가스 네트워크의 통합에 기인합니다. “REPowerEU”이 지역이 제시한 2030년까지 연간 35 bcm의 바이오메탄 생산 목표와 추정 370억 유로(400억 달러) 규모의 투자 수요가 해당 지역 전체의 장기적인 프로젝트 파이프라인을 지속적으로 뒷받침하고 있습니다. 독일에서는 290곳의 바이오메탄 정제 시설을 포함해 약 9,605곳의 바이오가스 플랜트가 가동 중이며, 2025년에는 12.8 TWh를 생산했습니다. 이는 해당 지역의 인프라 구축 수준을 나타냅니다. 한편, 독일 등 시장에서는 국내 내 시행 상황에 편차가 있고 규제 불확실성도 남아 있어, 개발 사업자에게는 자금 조달 및 사업 실행에 따른 위험이 계속해서 높아지고 있습니다.
북미는 연방 재생 가능 연료 기준(RFS), 캘리포니아주의 저탄소 연료 기준(LCFS), 각 주의 유기물 자원화 규제, 그리고 매립가스 및 혐기성 소화 프로젝트의 방대한 도입 실적을 바탕으로, 폐기물 유래 재생 가스 시장에서 여전히 상업적으로 가장 선진적인 지역 중 하나로 자리매김하고 있습니다. 2025년에는 미국에서 21억 달러 규모의 신규 바이오가스 투자 프로젝트가 가동을 시작했습니다. 자본 투자의 주된 부분은 매립지 프로젝트가 차지하고 있으며, 농업 분야가 그 뒤를 잇고 있습니다. 이는 원료의 유형에 관계없이 자본 투자의 범위가 점차 확대되고 있음을 보여줍니다. 또한, 미국에는 여전히 470곳의 매립지에서 가스가 플레어링되고 있으며, 이들 매립지는 RNG(재생 가능 천연가스)로 전환이 가능하기 때문에 추가 공급을 위한 가시적인 단기 개발 파이프라인이 확보되어 있습니다. 캐나다에서는 브리티시컬럼비아주와 온타리오주 등 여러 주에서 바이오메탄 조달 체계 및 지자체 프로젝트 지원 메커니즘 구축을 지속적으로 추진하고 있어, 지역적으로 확산되는 추세를 보이고 있습니다.
아시아태평양은 2026년부터 2031년까지 연평균 성장률(CAGR) 13.62%로 확대될 것으로 예상되며, 폐기물 유래 재생 가스 시장에서 가장 빠르게 성장하는 지역이 될 전망입니다. 이 지역의 성장은 급속한 도시화, 유기성 폐기물 양 증가, 그리고 중국이 주도하는 정책 표준화의 진전과 밀접한 관련이 있습니다. 중국의 기술 기준 "NB/T 11925-2025" 이는 보다 광범위한 산업 진흥의 일환으로 수립되었으나, IEA(국제에너지기구)의 바이오에너지 데이터에 따르면, 현재 바이오메탄 생산 능력은 해당 국가의 장기적인 자원 잠재력에 훨씬 미치지 못하고 있습니다. 인도 및 동남아시아에서는 폐기물 발생량 증가와 지역 프로젝트 체계의 개선에 힘입어 새로운 성장 거점으로 부상하고 있습니다. 브라질을 비롯한 남미에서는 매립지 가스 개발이 진행되고 있습니다. 한편, 중동 및 아프리카는 여전히 초기 단계 시장으로, 수거되지 않은 유기성 폐기물의 양이 막대한 반면, 인프라는 제한적입니다. 이러한 지역별 상황에 따라, 2031년까지는 유럽이 최대의 수익원이 되고, 북미는 고도로 발달한 상업 기반을 갖추며, 아시아태평양은 확장의 주요 원동력이 될 것으로 전망됩니다.
기타 혜택 :
- 엑셀 형식 시장 예측(ME) 시트
- 3개월간의 애널리스트 지원
자주 묻는 질문
목차
제1장 서론
제2장 조사 방법
제3장 주요 요약
제4장 시장 구도
제5장 시장 규모 및 성장 예측
제6장 경쟁 구도
제7장 시장 기회 및 향후 전망
KTH 26.07.07According to Mordor Intelligence, the renewable gas from waste market size was valued at USD 18.75 billion in 2025 and is estimated to grow from USD 20.34 billion in 2026 to reach USD 31.42 billion by 2031, at a CAGR of 9.09% during the forecast period (2026-2031).
This report is Segmented by Feedstock (Food Waste, Animal Manure, and More), by Technology (Gasification, Pyrolysis, and More), by Gas Type (Biogas, Syngas, and More), by Application (Electricity Generation, and More), by Component (Gas Collection, Digesters & Fermentation and More), and by Geography (North America, Europe, and More). The Market Forecasts are Provided in Terms of Value (USD).
Global Renewable Gas From Waste Market Trends and Insights
Government Incentives Like RFS, LCFS, and Biomethane Tariffs are Increasing
Government policy remains the clearest form of commercial support for the renewable gas from waste market, as it provides developers with a revenue base that lenders can underwrite. The United States EPA finalized its Set 2 Renewable Fuel Standard rule in March 2026 and set cellulosic biofuel obligations at 1.36 billion Renewable Identification Numbers (RINs) for 2026 and 1.43 billion RINs for 2027, keeping regulatory focus on biogas-derived pathways. That decision matters because renewable electricity was excluded from those qualifying volumes, which keeps D3 renewable identification number demand more concentrated on landfill-gas and anaerobic-digestion RNG projects. California also strengthened project visibility when its updated Low Carbon Fuel Standard (LCFS) rules took effect on July 1, 2025, and extended book-and-claim accounting for biomethane used in linear generators for EV charging through 2035. In Europe, REPowerEU continues to support the 35 bcm annual biomethane target for 2030, and the European Commission estimates cumulative investment needs at EUR 37 billion (USD 40 billion), keeping the renewable gas from waste market aligned with a large public policy build-out agenda.
Strict Methane-Emission Rules and Landfill-Gas Mandates Drive LFG-To-Energy Projects
Methane regulation is turning landfill gas capture from a voluntary environmental measure into a direct investment trigger in the renewable gas from waste market. The EPA Greenhouse Gas Reporting Program tracked 1,287 municipal solid waste and industrial waste landfills in 2023, and 83% of those sites were still actively receiving waste, leaving a large monitored base for further compliance activity. The American Biogas Council reported that 470 United States landfills are still flaring gas that could instead be converted into RNG, representing 1,322,000 scfm of untapped capture potential. As collection rules tighten, more operators are likely to favor RNG upgrades over simple flaring or direct combustion, since captured gas is more valuable when linked to transport and grid pathways.
High Capital is Required for LFG Systems, Upgrading Plants, and Pipeline Connections
Capital intensity remains a major barrier to the renewable gas from waste market, especially for projects that require new collection systems, gas-cleaning equipment, and pipeline connections. The American Biogas Council estimated that a full build-out of the United States biogas capture potential would require USD 450 billion in capital across candidate landfills, food waste facilities, farms, and wastewater sites. That scale of spending explains why developers continue to focus on sites with better existing infrastructure, stronger carbon-credit economics, or long-term off-take agreements. Pipeline interconnection also adds uncertainty because costs vary with distance from the network, utility gas specifications, and metering requirements, making site selection a financial issue from the start. This financing burden slows project formation in the renewable gas from waste market, particularly for independent developers without a large balance sheet or a portfolio partner.
Other drivers and restraints analyzed in the detailed report include:
- Corporate Decarbonization Pledges Boost Demand for Low-Carbon RNG
- The Heavy-Duty Transport Sector Shifts to CNG and LNG Fueled by Landfill RNG
- Inconsistent Regulations and Subsidies Create Market Fragmentation
For complete list of drivers and restraints, kindly check the Table Of Contents.
Segment Analysis
Municipal solid waste held the largest share at 35.4% in 2025, remaining at the core of the installed feedstock supply for the renewable gas from waste market. That position came from three durable advantages: regulated landfill infrastructure, predictable gas yield from mature waste cells, and the cellulosic qualification that supports D3 Renewable Identification Number generation under the United States RFS. Landfill projects also benefited from long operating histories in North America and Europe, which made them easier for lenders and developers to evaluate against newer waste pathways. Food waste is the fastest-growing feedstock segment and is projected to advance at a 10.2% CAGR from 2026 to 2031, reflecting state organics bans and the economics of diverting high-moisture organic material into anaerobic digestion. The American Biogas Council stated in February 2026 that food waste accounts for 15% of municipal solid waste streams in the United States and that more than 75% still ends up in landfills, leaving a large volume available for future diversion.
The same report counted only 124 standalone food waste anaerobic digestion facilities in the United States, with a combined capacity of 27.6 Bcf per year, versus a theoretical potential of 192 Bcf, underscoring how early this segment still is relative to its resource base. Agricultural residues and animal manure represent a distinct value pool in the renewable gas from waste industry, as dairy manure can earn very favorable lifecycle carbon scores under the LCFS and the federal RFS. That revenue stacking makes manure-based RNG especially attractive when carbon intensity is low enough to create value well above the gas's value. Industrial organic waste is also gaining ground because food processors, brewers, and pharmaceutical plants can combine gate-fee logic with long-term energy procurement. The Food and Agriculture Organization of the United Nations (FAO) and the Organization for Economic Co-operation and Development (OECD) outlook for 2025 to 2034 supports the long-term direction of this feedstock mix, as rising incomes and urbanization in middle-income countries are expected to lift food consumption and related waste volumes over time.
Anaerobic digestion accounted for 44.1% of the technology mix in 2025, making it the largest base in the renewable gas from waste market. Its lead reflects broad feedstock flexibility, as the same process family can work across wastewater sludge, food waste, animal manure, and mixed organics, with far greater commercial maturity than newer alternatives. Anaerobic digestion also benefits from a long operating record, which reduces lender uncertainty and supports standardized plant configurations. Co-digestion strengthens this advantage by allowing operators to blend different organic streams and smooth feedstock seasonality, thereby improving utilization rates. Research published in 2025 reported that process interventions such as zerovalent iron nanoparticles, biochar, and bioaugmentation can increase biogas yield and methane content under controlled conditions, suggesting further performance gains at existing facilities.
Landfill gas recovery remains important because it is embedded in the waste management infrastructure of regulated sites. Yet its long-term share is likely to come under pressure as diversion rules remove organics from landfills. Biogas upgrading is the fastest-growing technology segment and is projected to grow at a 11.1% CAGR through 2031, reflecting the stronger economics available in transport fuel and grid-injection pathways. Recent technical work points to lower energy use and higher gas purity across new upgrading designs, including four-column Vacuum Pressure Swing Adsorption (VPSA) systems and nanobubble-enhanced membrane approaches. Those improvements matter because higher methane purity and lower processing energy directly improve plant margins in the renewable gas from waste market. Gasification and pyrolysis remain part of the landscape. However, they are still more niche than anaerobic digestion and upgrading because their commercial base is smaller and their feedstock fit is narrower.
Complete Report Scope:
- By Feedstock
- Municipal Solid Waste (MSW)
- Agricultural Residues
- Animal Manure
- Industrial Organic Waste
- Sewage Sludge
- Food Waste
- Others
- By Technology
- Anaerobic Digestion
- Landfill Gas Recovery
- Gasification
- Pyrolysis
- Biogas Upgrading Systems
- Others
- By Gas Type
- Biogas
- Biomethane / Renewable Natural Gas (RNG)
- Syngas
- By Application
- Electricity Generation
- Combined Heat & Power (CHP)
- Grid Injection
- Transportation Fuel
- Industrial Heating
- Residential & Commercial Heating
- Others
- By Component
- Gas Collection Systems
- Digesters & Fermentation Systems
- Gas Processing & Upgrading Units
- Compressors & Storage Systems
- Power Generation Equipment
- Monitoring & Control Systems
- Others
- By Geography
- North America
- United States
- Canada
- Mexico
- South America
- Brazil
- Argentina
- Chile
- Rest of South America
- Europe
- Germany
- United Kingdom
- France
- Italy
- Spain
- Russia
- Benelux (Belgium, Netherlands, and Luxembourg)
- NORDICS (Denmark, Finland, Iceland, Norway, and Sweden)
- Rest of Europe
- Asia-Pacific
- China
- India
- Japan
- South Korea
- Australia
- Southeast Asia (Indonesia, Vietnam, Thailand, Malaysia, Philippines)
- Rest of Asia-Pacific
- Middle East & Africa
- United Arab Emirates
- Saudi Arabia
- South Africa
- Nigeria
- Rest of Middle East & Africa
- North America
Geography Analysis
Europe held 38.5% of the renewable gas from waste market share in 2025, making it the largest regional market in the current cycle. The region's lead comes from strong biomethane policy ambition, established digestion and upgrading assets, and broader gas network integration across multiple member states. REPowerEU's target of 35 bcm of biomethane per year by 2030, along with the estimated EUR 37 billion (USD 40 billion) investment requirement, continues to support long-term project pipelines across the region. Germany had approximately 9,605 biogas plants operating, including 290 biomethane upgrading facilities, which produced 12.8 TWh in 2025, demonstrating the depth of installed infrastructure in the region. At the same time, uneven national implementation and regulatory uncertainty in markets such as Germany continue to raise financing and execution risk for developers.
North America remained one of the most commercially advanced regions in the renewable gas from waste market, supported by the federal RFS, California's LCFS, state organics diversion rules, and a large installed base of landfill gas and anaerobic digestion projects. In 2025, USD 2.1 billion in new United States biogas investments came online, with landfill projects leading capital deployment and agriculture close behind, which shows that capital deployment is broadening across feedstock types. The United States also still has 470 landfills flaring gas that could be converted into RNG, preserving a visible near-term development pipeline for additional supply. Canada adds regional depth as provinces such as British Columbia and Ontario continue building biomethane procurement frameworks and municipal project support mechanisms.
Asia-Pacific is projected to expand at a 13.62% CAGR from 2026 to 2031, making it the fastest-growing region in the renewable gas from waste market. The region's growth is tied to rapid urbanization, rising organic waste volumes, and increasing policy standardization led by China. China's technical standard NB/T 11925-2025 took shape as part of a broader industrial push, while IEA (International Energy Agency) Bioenergy data show that current biomethane capacity remains far below the country's long-term resource potential. India and Southeast Asia are emerging as secondary growth centers as waste volumes rise and local project frameworks improve. South America, led by Brazil, is advancing landfill-gas development. At the same time, the Middle East and Africa remain early-stage markets with sizable volumes of uncaptured organic waste and more limited infrastructure. This regional mix leaves Europe as the largest revenue center, North America as a highly developed commercial base, and Asia-Pacific as the main runway for expansion through 2031.
- TotalEnergies SE
- Storengy SAS (ENGIE Group)
- Veolia Environnement S.A.
- SUEZ S.A.
- L'Air Liquide S.A.
- Gasum Oyj
- Waga Energy S.A.
- EnvITec Biogas AG
- Verbio SE
- Clean Energy Fuels Corp.
- Waste Management, Inc.
- Montauk Renewables, Inc.
- OPAL Fuels Inc.
- Gas Verde
- Orizon Valorizacao de Residuos S.A.
- Anaergia Inc.
- Future Biogas Ltd.
- Vanguard Renewables
- Shell plc
- bp plc
Additional Benefits:
- The market estimate (ME) sheet in Excel format
- 3 months of analyst support
TABLE OF CONTENTS
1 Introduction
- 1.1 Study Assumptions & Market Definition
- 1.2 Scope of the Study
2 Research Methodology
3 Executive Summary
4 Market Landscape
- 4.1 Market Overview
- 4.2 Market Drivers
- 4.2.1 Strict Methane-Emission Rules and Landfill-Gas Mandates Drive LFG-To-Energy Projects
- 4.2.2 Government Incentives Like RFS, LCFS, and Biomethane Tariffs Are Increasing
- 4.2.3 Corporate Decarbonization Pledges Boost Demand for Low-Carbon RNG
- 4.2.4 The Heavy-Duty Transport Sector Shifts To CNG/LNG Fueled by Landfill RNG
- 4.2.5 Urbanization And Food Waste Ensure a Steady Supply of Organic Waste
- 4.2.6 Advances In Biogas Upgrading Improve RNG Yield and Quality
- 4.3 Market Restraints
- 4.3.1 High Capital is Required for LFG Systems, Upgrading Plants, And Pipeline Connections
- 4.3.2 Landfill Gas Yields Decline as Waste Diversion and Recycling Improve
- 4.3.3 Inconsistent Regulations and Subsidies Create Market Fragmentation
- 4.3.4 Technical Issues Include Siloxane Contamination, Hydrogen Sulfide Removal, and Gas Quality Variability
- 4.4 Value / Supply-Chain Analysis
- 4.5 Regulatory Landscape
- 4.6 Technological Outlook
- 4.7 Porter's Five Forces
- 4.7.1 Threat of New Entrants
- 4.7.2 Bargaining Power of Suppliers
- 4.7.3 Bargaining Power of Buyers
- 4.7.4 Threat of Substitutes
- 4.7.5 Industry Rivalry
- 4.8 Impact of Artificial Intelligence-Powered Waste Collection on Service Providers' Revenue Growth
- 4.9 Consumer Behavior Shifts Toward Zero-Waste Lifestyles Influencing Service Demand
- 4.10 Impact of Geopolitical Events on the Market
5 Market Size & Growth Forecasts
- 5.1 By Feedstock
- 5.1.1 Municipal Solid Waste (MSW)
- 5.1.2 Agricultural Residues
- 5.1.3 Animal Manure
- 5.1.4 Industrial Organic Waste
- 5.1.5 Sewage Sludge
- 5.1.6 Food Waste
- 5.1.7 Others
- 5.2 By Technology
- 5.2.1 Anaerobic Digestion
- 5.2.2 Landfill Gas Recovery
- 5.2.3 Gasification
- 5.2.4 Pyrolysis
- 5.2.5 Biogas Upgrading Systems
- 5.2.6 Others
- 5.3 By Gas Type
- 5.3.1 Biogas
- 5.3.2 Biomethane / Renewable Natural Gas (RNG)
- 5.3.3 Syngas
- 5.4 By Application
- 5.4.1 Electricity Generation
- 5.4.2 Combined Heat & Power (CHP)
- 5.4.3 Grid Injection
- 5.4.4 Transportation Fuel
- 5.4.5 Industrial Heating
- 5.4.6 Residential & Commercial Heating
- 5.4.7 Others
- 5.5 By Component
- 5.5.1 Gas Collection Systems
- 5.5.2 Digesters & Fermentation Systems
- 5.5.3 Gas Processing & Upgrading Units
- 5.5.4 Compressors & Storage Systems
- 5.5.5 Power Generation Equipment
- 5.5.6 Monitoring & Control Systems
- 5.5.7 Others
- 5.6 By Geography
- 5.6.1 North America
- 5.6.1.1 United States
- 5.6.1.2 Canada
- 5.6.1.3 Mexico
- 5.6.2 South America
- 5.6.2.1 Brazil
- 5.6.2.2 Argentina
- 5.6.2.3 Chile
- 5.6.2.4 Rest of South America
- 5.6.3 Europe
- 5.6.3.1 Germany
- 5.6.3.2 United Kingdom
- 5.6.3.3 France
- 5.6.3.4 Italy
- 5.6.3.5 Spain
- 5.6.3.6 Russia
- 5.6.3.7 Benelux (Belgium, Netherlands, and Luxembourg)
- 5.6.3.8 NORDICS (Denmark, Finland, Iceland, Norway, and Sweden)
- 5.6.3.9 Rest of Europe
- 5.6.4 Asia-Pacific
- 5.6.4.1 China
- 5.6.4.2 India
- 5.6.4.3 Japan
- 5.6.4.4 South Korea
- 5.6.4.5 Australia
- 5.6.4.6 Southeast Asia (Indonesia, Vietnam, Thailand, Malaysia, Philippines)
- 5.6.4.7 Rest of Asia-Pacific
- 5.6.5 Middle East & Africa
- 5.6.5.1 United Arab Emirates
- 5.6.5.2 Saudi Arabia
- 5.6.5.3 South Africa
- 5.6.5.4 Nigeria
- 5.6.5.5 Rest of Middle East & Africa
- 5.6.1 North America
6 Competitive Landscape
- 6.1 Market Concentration
- 6.2 Strategic Moves
- 6.3 Market Share Analysis
- 6.4 Company Profiles (Includes Global Level Overview, Market Level Overview, Core Segments, Financials as Available, Strategic Information, Products & Services, and Recent Developments)
- 6.4.1 TotalEnergies SE
- 6.4.2 Storengy SAS (ENGIE Group)
- 6.4.3 Veolia Environnement S.A.
- 6.4.4 SUEZ S.A.
- 6.4.5 L'Air Liquide S.A.
- 6.4.6 Gasum Oyj
- 6.4.7 Waga Energy S.A.
- 6.4.8 EnviTec Biogas AG
- 6.4.9 Verbio SE
- 6.4.10 Clean Energy Fuels Corp.
- 6.4.11 Waste Management, Inc.
- 6.4.12 Montauk Renewables, Inc.
- 6.4.13 OPAL Fuels Inc.
- 6.4.14 Gas Verde
- 6.4.15 Orizon Valorizacao de Residuos S.A.
- 6.4.16 Anaergia Inc.
- 6.4.17 Future Biogas Ltd.
- 6.4.18 Vanguard Renewables
- 6.4.19 Shell plc
- 6.4.20 bp plc
7 Market Opportunities & Future Outlook
- 7.1 White-Space & Unmet-Need Assessment


