

|
시장보고서
상품코드
2100498
POS 단말기 시장 : 시장 점유율 분석, 업계 동향 및 통계, 성장 예측(2026-2031년)Point-of-Sale Terminal - Market Share Analysis, Industry Trends & Statistics, Growth Forecasts (2026 - 2031) |
||||||
 Mordor Intelligence
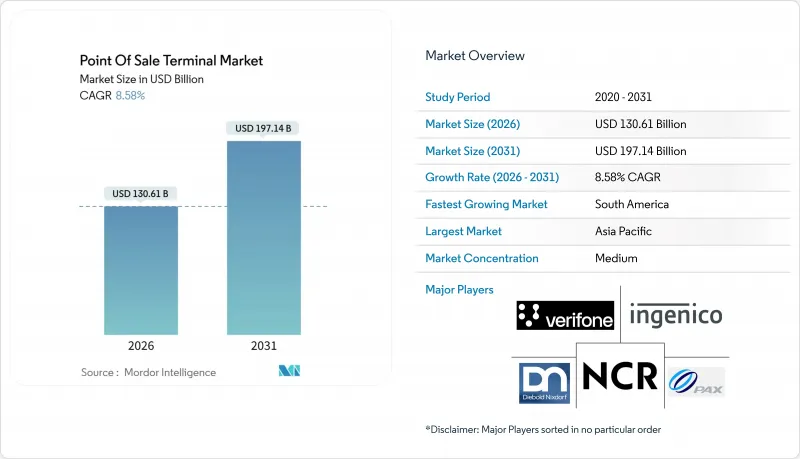
Mordor Intelligence에 의하면, POS 단말기 시장 규모는 2026년에 1,306억 1,000만 달러로 추정되고, 2031년까지 1,971억 4,000만 달러에 이를 것으로 예측되며, 2026-2031년 연평균 복합 성장률(CAGR)은 8.58%로 성장이 전망됩니다.
본 보고서는 결제 방식별(접촉식 및 비접촉식), POS 유형별(고정형 POS 시스템, 모바일/휴대용 POS 시스템), 구성 요소별(하드웨어, 소프트웨어, 서비스), 도입 형태별(클라우드 기반, 온프레미스형), 최종 사용자 산업별(소매, 호스피탈리티, 의료, 기타), 지역별로 분류되어 있습니다. 시장 전망은 금액(달러) 기준으로 제시되어 있습니다.
세계의 POS 단말기 시장 동향 및 인사이트
소매 산업에서의 도입 확대
통합 상거래(Unified Commerce) 이니셔티브를 통해 매장, 온라인, 모바일에서의 구매를 단일 단말기 인터페이스를 통해 처리할 수 있게 되었으며, 매장 진열대에서 상품을 조달하여 디지털 주문을 이행하고 라스트 마일 비용을 절감할 수 있게 되었습니다. 퀵서비스 레스토랑에서는 결제와 메뉴 맞춤 설정을 결합한 셀프 서비스 키오스크를 도입하고 있으며, 알고리즘에 기반한 추가 상품 추천을 통해 인건비를 절감하고 1인당 구매액을 증가시키고 있습니다. 유럽과 북미의 식료품 체인점에서는 쇼핑객이 유인 계산대를 거치지 않고 바로 결제할 수 있는 ‘스캔 앤 고(Scan & Go)’ 방식의 스마트폰 앱 시범 운영이 진행되고 있으나, 도난 방지 대책과 연령 확인 규정이 여전히 과제로 남아 있습니다. 패션 매장에서는 점원에게 모바일 단말기를 지급하여 매장에서 즉시 판매를 완료함으로써, 줄을 서 있는 동안의 구매 포기율을 대폭 줄이고 있습니다. 고급 소매업체에서는 지문 인증 리더기를 탑재하여 할부 대출이나 포인트 이용 시 본인 확인 절차를 효율화하고 있습니다.
클라우드 기반 POS 플랫폼의 보급 확대
클라우드 아키텍처는 처리 로직을 고정된 하드웨어에서 분리하기 때문에 사업자는 어떤 웹 기기에서든 거래 데이터, 재고 데이터, 고객 데이터를 확보할 수 있으며, 이 모델을 통해 현장의 IT 비용을 절감할 수 있습니다. 소프트웨어의 자동 업데이트로 인해 기술자의 출장 비용이 불필요해지며, 수백 대의 단말기를 운영하는 체인점에게는 큰 이점이 됩니다. 구독형 요금 체계를 통해 설비 투자(CapEx)가 예측 가능한 운영비(OpEx)로 전환되므로, 중소기업에게도 업그레이드가 합리적인 가격으로 제공됩니다. 개방형 애플리케이션 프로그래밍 인터페이스(API)를 통해 회계, 인력 스케줄링, 마케팅 기능이 핵심 결제 흐름과 통합되어, 단말기는 비즈니스 관리의 허브로 변모합니다. 지속적인 클라우드 백업으로 재해 복구 능력이 강화되며, 공급자 수준의 PCI 규정 준수를 통해 개별 가맹점이 안고 있는 감사 관련 복잡성이 완화됩니다.
데이터 보안 및 사이버 사기 관련 우려
휘발성 메모리에서 데이터를 추출하는 악성코드는 펌웨어 패치 적용이 지연될 경우, 암호화되기 전의 원시 카드 데이터를 탈취할 가능성이 있어 단말기는 여전히 매력적인 공격 대상이 되고 있습니다. PCI DSS 위반에 대한 벌금은 건당 50만 달러에 달할 수 있으며, 규정 준수 위반이 장기화될 경우 결제 처리 권한이 박탈될 우려가 있습니다. 중소기업은 사이버 보안 담당자가 부족한 경우가 많아, 그로 인해 구형 소프트웨어를 계속 사용하고 있습니다. 토큰화나 포인트-투-포인트 암호화는 위험을 완화하지만, 하드웨어나 아퀴어러의 업그레이드에는 비용이 발생하여 도입을 저해하고 있습니다. 유럽의 ‘디지털 운영 복원력 법(DORA)’에 따라 결제 제공업체는 사고를 24시간 이내에 보고해야 할 의무가 부과되어, 규정 준수 예산이 증가하고 있습니다.
부문 분석
2025년, POS 단말기 시장 매출액 중 접촉형 단말기가 71.23%를 차지했습니다. 이는 전 세계적인 책임 전가 추세에 따라 칩 앤 PIN이 도입된 데 기인합니다. 고가 상품을 취급하는 가맹점에서는 여전히 PIN 인증을 통한 추가 보안이 선호되고 있습니다. 비접촉식 결제 수용은 ‘탭 앤 고(Tap & Go)’의 편의성과 현금 의존도가 높은 사업에 벌금을 부과하는 정부의 인센티브에 힘입어 2031년까지 연평균 성장률(CAGR) 9.32%로 확대되고 있습니다. 교통, 편의점, 패스트푸드점이 도입을 주도하고 있는데, 이는 처리 속도 향상으로 대기 시간이 단축되기 때문입니다.
접촉식과 비접촉식 모두를 지원하는 하이브리드 단말기는 근거리 무선 통신용 안테나 추가 비용이 부품 원가에서 불과 2-3달러에 불과하기 때문에 표준으로 자리 잡고 있습니다. 아시아태평양에서는 정적 QR 코드가 결제 옵션을 더욱 다양화시켜 가맹점이 고가의 하드웨어를 도입할 필요가 없어지고 있습니다. 신원 확인을 신속하게 하기 위해 고급 소매점이나 병원 약국에서는 생체 인증(지문 인증 및 얼굴 인증)에 대한 초기 시범 프로젝트가 진행 중입니다.
2025년에도 고정식 카운터 시스템은 POS 단말기 시장의 54.42%를 차지했으며, 직원이 상주하는 계산대에서 대량의 거래를 처리하는 식료품 체인점이나 약국에 의해 지탱되고 있습니다. 공간과 전원이 충분히 확보된 장소에서는 내장형 스캐너와 현금 서랍이 계산원의 효율을 극대화합니다. 한편, 모바일형 및 휴대용 단말기는 연평균 성장률(CAGR) 9.67%로 확대되고 있으며, 서비스 제공 장소에 관계없이 결제가 필요한 푸드트럭, 수리 기술자, 노점상 등을 끌어들이고 있습니다.
태블릿형 시스템은 고급 레스토랑에서 주류를 이루고 있으며, 웨이터가 테이블 옆에서 계산을 분할하고 결제 처리를 할 수 있어 테이블 회전율을 낮추고 팁 비율을 높이고 있습니다. 팔찌나 반지 등의 웨어러블 단말기는 축제나 경기장에서 시험적으로 도입되고 있지만, 배터리 수명이 제한적이어서 그 이용은 틈새 시장에 그치고 있습니다. 내환경성이 뛰어난 핸드헬드 단말기는 창고나 택배 차량에서 활용되고 있으며, 가혹한 환경에서도 재고 스캔과 결제 업무를 동시에 수행하고 있습니다.
지역별 분석
아시아태평양은 중국의 방대한 가맹점 기반과 인도의 통합 결제 인터페이스(UPI)를 견인력으로 삼아, 2025년 매출의 40.52%를 차지했습니다. 전 세계 전자 지갑 업체들이 사용자 확보 경쟁을 벌이는 가운데, 중국에서는 QR 코드에서 비접촉식 근거리 무선 통신(NFC)으로의 전환이 가속화되고 있습니다. 인도에서는 세무 디지털화 추진으로 단말기 보급률이 향상되었으나, 통신 환경과 수수료에 대한 민감성으로 인해 농촌 지역에서의 보급은 더딘 임베디드니다. 일본에서는 고령화가 진행되면서 모바일 결제의 보급이 둔화되고 있지만, 2025년 오사카 엑스포를 계기로 호스피탈리티 산업의 설비 갱신이 진행되었습니다. 한국은 생체 인증 결제의 시험 운영에 있어 ‘샌드박스’ 역할을 수행하고 있는 반면, 인도네시아, 태국, 베트남에서는 옴니채널 플랫폼을 활용해 전자상거래와 오프라인 매장의 연계를 도모하고 있습니다.
유럽에서는 ‘디지털 시대의 부가가치세(VAT)’ 계획이나 독일의 ‘Kassensicherungsverordnung(금전 등록기 보안 규정)’과 같은 세무 규제로 인해 단말기 교체 주기가 앞당겨지고 있습니다. 인증된 보안 모듈은 하드웨어 비용을 증가시키지만, 세무 당국에 실시간 가시성을 제공합니다. 영국의 브렉시트 이후 규제 차이로 인해 소매업체들은 서로 다른 단말기 구성에 대응해야 하는 상황에 직면해 있습니다. 북유럽 국가들은 무현금 결제로 전환되고 있어 현금과 카드를 모두 지원하는 하이브리드 단말기에 대한 수요는 감소하고 있지만, 반면 동유럽에서는 EU 가입을 계기로 인프라 현대화가 진행되고 있습니다.
북미 시장은 성숙 단계에 접어들었으나 혁신이 활발합니다. Square와 Toast의 통합 플랫폼은 급여 계산, 분석, 로열티 프로그램을 묶어 제공함으로써 기존 벤더들을 대체하고 있습니다. 주별 세제 차이와 제각각인 개인정보 보호 규제로 인해 규정 준수 대응이 복잡해지고 있으며, 이는 자동화 소프트웨어 도입을 촉진하고 있습니다. 캐나다의 실시간 결제 시스템은 가맹점의 현금 흐름을 개선하는 한편, 멕시코에서는 전자 청구서의 적용 범위가 확대됨에 따라 지방별 시행 상황에 편차가 있음에도 불구하고 소규모 사업자들이 인증 단말기 도입을 강요받고 있습니다.
남미는 예측 연평균 성장률(CAGR) 10.18%로 가장 빠르게 성장하고 있으며, 이를 주도하는 것은 규정 위반 가맹점에 실시간으로 벌금을 부과하는 브라질의 ‘Nota Fiscal Eletronica’입니다. 아르헨티나의 인플레이션으로 인해 소비자들은 할부 카드 결제 방식을 이용하게 되면서 전자 결제 수용이 확대되고 있습니다. 칠레와 콜롬비아도 유사한 세제 체계를 마련 중이며, 서비스 제공 범위가 넓은 벤더들에게는 지역적인 비즈니스 기회가 확대되고 있습니다. 중동 및 아프리카는 여전히 발전 단계에 있지만, 케냐와 나이지리아의 모바일 머니는 기존 단말기를 뛰어넘을 가능성이 있는 대체 인프라를 구축해 나가고 있습니다.
기타 혜택
- 엑셀 형식 시장 예측(ME) 시트
- 3개월간의 애널리스트 지원
자주 묻는 질문
목차
제1장 서론
제2장 조사 방법
제3장 주요 요약
제4장 시장 구도
제5장 시장 규모 및 성장 예측
제6장 경쟁 구도
제7장 시장 기회 및 향후 전망
AJY 26.08.11According to Mordor Intelligence, the point-of-Sale terminal market size stood at USD 130.61 billion in 2026 and is projected to reach USD 197.14 billion by 2031, translating into an 8.58% CAGR during 2026-2031.
This report is Segmented by Mode of Payment Acceptance (Contact-Based, and Contactless), POS Type (Fixed Point-Of-Sale Systems, and Mobile/Portable Point-Of-Sale Systems), Component (Hardware, Software, and Services), Deployment Mode (Cloud-Based, and On-Premise), and End-User Industry (Retail, Hospitality, Healthcare, and More) and Geography. The Market Forecasts are Provided in Terms of Value (USD).
Global Point-of-Sale Terminal Market Trends and Insights
Growing Adoption in the Retail Sector
Unified commerce initiatives allow store, online, and mobile purchases to clear through a single terminal interface, enabling stock sourced from store shelves to fulfill digital orders and trimming last-mile costs. Quick-service restaurants deploy self-service kiosks that marry payment with menu customization, cutting labor expenses and boosting basket size by presenting algorithmic add-ons. Grocery chains in Europe and North America piloted scan-and-go phone apps that let shoppers bypass staffed lanes, though theft controls and age-verification rules remain hurdles. Fashion stores equip associates with mobile devices that close sales on the showroom floor, slashing queue abandonment. Luxury retailers embed fingerprint readers to streamline identity confirmation for installment financing and loyalty redemption.
Rising Adoption of Cloud-based POS Platforms
Cloud architectures decouple processing logic from fixed hardware, so merchants retrieve transaction, stock, and customer data from any web device, a model that trims on-site IT costs. Automatic software updates end the expense of technician truck rolls, a boon to chains operating hundreds of terminals. Subscription pricing converts cap-ex to forecastable op-ex, making upgrades affordable for small businesses. Open application-programming-interfaces weave accounting, workforce scheduling, and marketing functions around the core payment flow, transforming terminals into business-management hubs. Continuous cloud backup improves disaster recovery, and provider-level PCI compliance shifts audit complexity away from individual merchants.
Data-Security and Cyber-fraud Concerns
Malware that scrapes volatile memory can snatch raw card data before encryption if firmware patches lag, keeping terminals an attractive attack vector. PCI DSS penalties may reach USD 500,000 per breach and prolonged non-compliance can lead to terminated processing privileges. Small businesses often lack cybersecurity staff, so outdated software persists. Tokenization and point-to-point encryption curb risk, yet hardware and acquirer upgrades impose costs that deter adoption. Europe's Digital Operational Resilience Act now forces payment providers to report incidents within 24 hours, lifting compliance budgets.
Other drivers and restraints analyzed in the detailed report include:
- Accelerating Demand for Contactless and Mobile Payments
- Integration of POS Data with Advanced Analytics and CRM
- Hardware Reliability and Maintenance-cost Issues
For complete list of drivers and restraints, kindly check the Table Of Contents.
Segment Analysis
Contact-based terminals accounted for 71.23% of the Point-of-Sale Terminal Market revenue in 2025, a legacy of chip-and-PIN rollouts following global liability shifts. High-ticket merchants still favor the added security of PIN verification. Contactless acceptance is scaling at a 9.32% CAGR through 2031, fueled by tap-and-go convenience and government incentives that penalize cash-heavy operations. Transit agencies, convenience stores, and quick-service restaurants lead adoption because faster throughput trims queue times.
Hybrid devices accepting both contact and contactless are becoming standard, as a near-field antenna adds only USD 2-3 to the bill of materials. In the Asia-Pacific region, static quick-response codes further diversify checkout options, allowing merchants to forgo costly hardware. Early pilots of biometric authentication, fingerprint and facial recognition, are underway in luxury retail and hospital pharmacies to accelerate identity proofing.
Fixed countertop systems still accounted for 54.42% of the Point-of-Sale Terminal Market in 2025, buoyed by grocery chains and pharmacies that process high transaction volumes at staffed stations. Integrated scanners and cash drawers maximize cashier efficiency where space and power are plentiful. Mobile and portable units, however, are advancing at a 9.67% CAGR, enticing food trucks, repair technicians, and outdoor vendors that require payment anywhere service is delivered.
Tablet-based systems dominate upscale restaurants, allowing servers to split checks and process payments tableside, reducing table turns and boosting tip percentages. Wearable forms such as wristbands and rings are trialed at festivals and stadiums, though limited battery life keeps usage niche. Ruggedized handhelds serve warehouses and courier fleets, marrying inventory scanning with payment collection under harsh conditions.
Complete Report Scope:
- By Mode of Payment Acceptance
- Contact-based
- Contactless
- By POS Type
- Fixed Point-of-Sale Systems
- Mobile / Portable Point-of-Sale Systems
- By Component
- Hardware
- Software
- Services
- By Deployment Mode
- Cloud-based
- On-Premise
- By End-User Industry
- Retail
- Hospitality
- Healthcare
- Transportation and Logistics
- Other End-User Industries
- By Geography
- North America
- United States
- Canada
- Mexico
- Europe
- Germany
- United Kingdom
- France
- Spain
- Italy
- Rest of Europe
- Asia-Pacific
- China
- Japan
- India
- South Korea
- Southeast Asia
- Rest of Asia-Pacific
- South America
- Brazil
- Argentina
- Rest of South America
- Middle East and Africa
- Middle East
- GCC
- Turkey
- Rest of Middle East
- Africa
- South Africa
- Nigeria
- Rest of Africa
- Middle East
- North America
Geography Analysis
Asia-Pacific delivered 40.52% of 2025 turnover, anchored by China's vast merchant base and India's Unified Payments Interface. China's shift from QR codes to contactless near-field communication is accelerating as global wallets compete for traffic. India's tax digitization push lifted terminal density, though rural adoption lags due to connectivity and fee sensitivity. Japan's aging demography tempers mobile uptake yet the 2025 Osaka Expo spurred hospitality upgrades. South Korea serves as a sandbox for biometric settlement trials, while Indonesia, Thailand, and Vietnam lean on omnichannel platforms to mesh e-commerce with storefronts.
Europe is in a replacement cycle triggered by fiscalization edicts such as the VAT in the Digital Age plan and Germany's Kassensicherungsverordnung. Certified security modules raise hardware costs but give tax agencies real-time visibility. The United Kingdom's post-Brexit divergence forces retailers to juggle distinct device configurations. Nordic countries are nearing cashless status, reducing demand for hybrid cash-card terminals, while EU accession is spurring infrastructure modernization in Eastern Europe.
North America is mature yet innovation-rich. Integrated platforms from Square and Toast displace legacy vendors by bundling payroll, analytics, and loyalty. State-level tax variation and patchwork privacy rules create compliance complexity that favors automated software. Canada's real-time rails improve cash flow for merchants, while Mexico's expanded e-invoicing mandate pushes micro-businesses toward certified devices despite uneven rural enforcement.
South America is the fastest riser at a predicted 10.18% CAGR, led by Brazil's Nota Fiscal Eletronica, which fines non-compliant merchants in real time. Argentina's inflation pushes consumers toward installment card plans, expanding electronic acceptance. Chile and Colombia are drafting similar fiscal frameworks, opening regional opportunities for vendors with service coverage. The Middle East and Africa remain nascent, but mobile money in Kenya and Nigeria is laying alternative rails that may leapfrog conventional terminals.
- Ingenico SA (Worldline)
- VeriFone Systems Inc.
- PAX Technology Ltd.
- NCR Corporation
- Diebold Nixdorf Inc.
- Toshiba Global Commerce Solutions
- HP Inc.
- Panasonic Corporation
- Fujitsu Ltd.
- Samsung Electronics Co. Ltd.
- Newland Payment Technology
- BBPOS Ltd.
- Square Inc. (Block)
- Fiserv Inc. (Clover)
- Lightspeed Commerce Inc.
- Shopify Inc. (Shopify POS)
- Toast Inc.
- Revel Systems Inc.
- Oracle Corporation (MICROS)
- Agilysys Inc.
- Aptos Inc.
- GK Software SE
- NEC Corporation
- NEXGO (Shenzhen Xinguodu Technology)
- Qashier Pte Ltd.
- Cegid Group
- Cow Hills Retail BV
- PCMS Group Ltd.
- SumUp Payments Limited
- Adyen N.V.
Additional Benefits:
- The market estimate (ME) sheet in Excel format
- 3 months of analyst support
TABLE OF CONTENTS
1 INTRODUCTION
- 1.1 Study Assumptions and Market Definition
- 1.2 Scope of the Study
2 RESEARCH METHODOLOGY
3 EXECUTIVE SUMMARY
4 MARKET LANDSCAPE
- 4.1 Market Overview
- 4.2 Market Drivers
- 4.2.1 Growing Adoption in the Retail Sector
- 4.2.2 Rising Adoption of Cloud-based POS Platforms
- 4.2.3 Accelerating Demand for Contactless and Mobile Payments
- 4.2.4 Integration of POS Data with Advanced Analytics and CRM
- 4.2.5 Regulatory Push for Fiscalisation and E-invoicing Mandates
- 4.2.6 Subscription-based "POS-as-a-Service" Models Lowering Cap-Ex
- 4.3 Market Restraints
- 4.3.1 Data-Security and Cyber-fraud Concerns
- 4.3.2 Hardware Reliability and Maintenance-cost Issues
- 4.3.3 Fragmentation of Regional Payment Standards
- 4.3.4 Semiconductor Supply-chain Volatility
- 4.4 Value Chain Analysis
- 4.5 Regulatory Landscape
- 4.6 Technological Outlook (IoT, AI, Edge-processing)
- 4.7 Porter's Five Forces Analysis
- 4.7.1 Bargaining Power of Suppliers
- 4.7.2 Bargaining Power of Buyers
- 4.7.3 Threat of New Entrants
- 4.7.4 Threat of Substitutes
- 4.7.5 Intensity of Competitive Rivalry
- 4.8 Assessment of Macro Economic Trends on the Market
5 MARKET SIZE AND GROWTH FORECASTS (VALUE)
- 5.1 By Mode of Payment Acceptance
- 5.1.1 Contact-based
- 5.1.2 Contactless
- 5.2 By POS Type
- 5.2.1 Fixed Point-of-Sale Systems
- 5.2.2 Mobile / Portable Point-of-Sale Systems
- 5.3 By Component
- 5.3.1 Hardware
- 5.3.2 Software
- 5.3.3 Services
- 5.4 By Deployment Mode
- 5.4.1 Cloud-based
- 5.4.2 On-Premise
- 5.5 By End-User Industry
- 5.5.1 Retail
- 5.5.2 Hospitality
- 5.5.3 Healthcare
- 5.5.4 Transportation and Logistics
- 5.5.5 Other End-User Industries
- 5.6 By Geography
- 5.6.1 North America
- 5.6.1.1 United States
- 5.6.1.2 Canada
- 5.6.1.3 Mexico
- 5.6.2 Europe
- 5.6.2.1 Germany
- 5.6.2.2 United Kingdom
- 5.6.2.3 France
- 5.6.2.4 Spain
- 5.6.2.5 Italy
- 5.6.2.6 Rest of Europe
- 5.6.3 Asia-Pacific
- 5.6.3.1 China
- 5.6.3.2 Japan
- 5.6.3.3 India
- 5.6.3.4 South Korea
- 5.6.3.5 Southeast Asia
- 5.6.3.6 Rest of Asia-Pacific
- 5.6.4 South America
- 5.6.4.1 Brazil
- 5.6.4.2 Argentina
- 5.6.4.3 Rest of South America
- 5.6.5 Middle East and Africa
- 5.6.5.1 Middle East
- 5.6.5.1.1 GCC
- 5.6.5.1.2 Turkey
- 5.6.5.1.3 Rest of Middle East
- 5.6.5.2 Africa
- 5.6.5.2.1 South Africa
- 5.6.5.2.2 Nigeria
- 5.6.5.2.3 Rest of Africa
- 5.6.5.1 Middle East
- 5.6.1 North America
6 COMPETITIVE LANDSCAPE
- 6.1 Market Concentration
- 6.2 Strategic Moves
- 6.3 Market Share Analysis
- 6.4 Company Profiles (Includes Global Level Overview, Market Level Overview, Core Segments, Financials as Available, Strategic Information, Market Rank/Share for Key Companies, Products and Services, and Recent Developments)
- 6.4.1 Ingenico SA (Worldline)
- 6.4.2 VeriFone Systems Inc.
- 6.4.3 PAX Technology Ltd.
- 6.4.4 NCR Corporation
- 6.4.5 Diebold Nixdorf Inc.
- 6.4.6 Toshiba Global Commerce Solutions
- 6.4.7 HP Inc.
- 6.4.8 Panasonic Corporation
- 6.4.9 Fujitsu Ltd.
- 6.4.10 Samsung Electronics Co. Ltd.
- 6.4.11 Newland Payment Technology
- 6.4.12 BBPOS Ltd.
- 6.4.13 Square Inc. (Block)
- 6.4.14 Fiserv Inc. (Clover)
- 6.4.15 Lightspeed Commerce Inc.
- 6.4.16 Shopify Inc. (Shopify POS)
- 6.4.17 Toast Inc.
- 6.4.18 Revel Systems Inc.
- 6.4.19 Oracle Corporation (MICROS)
- 6.4.20 Agilysys Inc.
- 6.4.21 Aptos Inc.
- 6.4.22 GK Software SE
- 6.4.23 NEC Corporation
- 6.4.24 NEXGO (Shenzhen Xinguodu Technology)
- 6.4.25 Qashier Pte Ltd.
- 6.4.26 Cegid Group
- 6.4.27 Cow Hills Retail BV
- 6.4.28 PCMS Group Ltd.
- 6.4.29 SumUp Payments Limited
- 6.4.30 Adyen N.V.
7 MARKET OPPORTUNITIES AND FUTURE OUTLOOK
- 7.1 White-space and Unmet-need Assessment


