

|
시장보고서
상품코드
2116585
화학제품 물류 시장 : 점유율 분석, 업계 동향과 통계, 성장 예측(2026-2031년)Chemical Logistics - Market Share Analysis, Industry Trends & Statistics, Growth Forecasts (2026 - 2031) |
||||||
 Mordor Intelligence
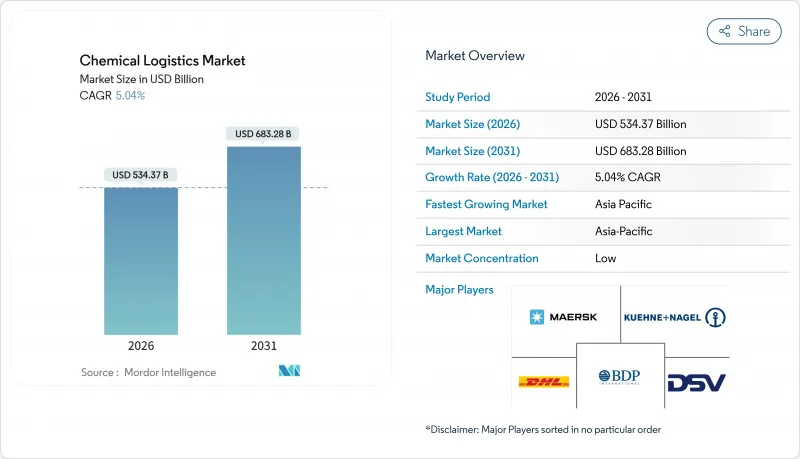
Mordor Intelligence에 의하면, 화학제품 물류 시장 규모는 2026년에 5,343억 7,000만 달러로 추정되고 있어 예측 기간(2026-2031년)에서 CAGR 5.04%로 성장을 지속하여, 2031년에는 6,832억 8,000만 달러에 이를 전망입니다.
본 보고서는 서비스 유형(운송, 창고 보관 등), 최종 사용자 산업별(제약, 화장품, 석유 및 가스, 특수 화학제품 등), 위험성 분류별(위험물, 비위험물), 온도 관리(온도 관리 있음, 온도 관리 없음), 지역(북미, 유럽, 기타)별로 분류되어 있습니다. 시장 전망은 금액(달러) 기준으로 제시되어 있습니다.
세계 화학제품 물류 시장 동향과 인사이트
아시아의 화학제품 생산 확대가 장거리 운송량을 끌어올리고 있다.
인도의 PCPIR 구역 및 중국 본토의 생산 능력 증강으로 인해 수출 경로가 유럽 및 북미로 이동하면서 항해 거리가 길어지고 톤마일 수요가 증가하고 있습니다. 홍해 항로 변경에 따른 경로 변경으로 아시아-유럽 간 표준 운송 시간이 더욱 연장되어 선박 가동률이 향상되고, 철도·해상 복합 운송 회랑에서의 복합 운송 기회가 촉진되고 있습니다. 인도 정부의 우대 조치로 인해 생산은 연안 클러스터에 집중되어 있지만, 내륙 지역의 소비 패턴으로 인해 국내 운송 거리가 길어지고 있어, 철도, 도로, 바지선을 통합한 솔루션을 제공하는 사업자에게는 호재가 되고 있습니다.
위험물의 비용과 안전성을 고려한 복합 운송 네트워크의 이용 확대
해상-육상 복합 운송 시스템은 육상 운송만 이용할 경우와 비교하여 온실가스 배출량을 81%, 물류 비용을 70% 절감하지만, 그 도입은 운송 수단 간 연결 지점에서의 규제가 원활하게 조화를 이루는 데 달려 있습니다. 미국 연방철도청(FRA)은 유틸리티 회사와의 제휴를 통한 지원이 있다면, 벌크 화학물질 수송 회랑에서 듀얼 모드 기관차나 간헐적인 전철화가 비용 대비 효과가 뛰어나다고 강조하고 있습니다. Bertschi사 등 유럽의 사업자들은 철도, 바지선, 도로 구간을 동기화하는 통합 터미널을 통해 이미 연간 30만 톤의 CO2 배출을 감축하고 있습니다.
설비 투자가 막대하고, 자산 및 보험 관련 요건이 까다롭습니다.
스테인리스제 ISO 탱크, 온도 관리형 섀시, 방폭 창고의 비용은 일반 화물용 설비의 2-3배에 달할 전망입니다. Peacock Container사가 실시한 3억 5,000만 달러 규모의 지속가능성 연계 시설 확장 프로젝트는 차량 갱신에 필요한 자본 규모를 여실히 보여줍니다. 현재 위험물 운송에 드는 보험료는 수익의 최대 5%를 차지하고 있어 진입 장벽을 더욱 높이고 있습니다.
부문 분석
2025년에도 물리적 운송이 여전히 필수적이기 때문에 화학제품 물류 시장에서 운송 부문의 점유율은 65.14%를 유지했습니다. 그러나 블렌딩, 규정 준수 관리, 오케스트레이션 플랫폼 등을 포괄하는 ‘기타 서비스’는 행정 부담을 경감하는 원스톱 솔루션에 대한 화주 수요를 반영하여 연평균 성장률(CAGR) 6.41%를 나타낼 것으로 예측됩니다. 부가가치형 창고는 재고를 소비 거점 근처에 배치함으로써 운전 자본 프로그램을 지원하고 있는 반면, 디지털 플랫폼은 예측 스케줄링 및 배출량 보고의 기반이 되는 데이터 엑소스트를 수집하고 있습니다. DHL의 CryoPDP 인수를 통해 연간 60만 건의 온도 관리가 필요한 화물이 추가되었으며, 이러한 ‘택인(tuck-in)’이 역량 확대를 어떻게 가속화하는지 보여주고 있습니다.
2세대 4PL 모델은 운송업체 조달, 컨트롤 타워를 통한 분석, 규정 준수 관련 문서를 구독 패키지에 통합함으로써 오케스트레이션을 수익화하고 있습니다. 화주들이 이러한 API를 전사적 자원 관리(ERP) 시스템에 통합함에 따라 전환 비용이 증가하여, 물류 제공업체는 일반 화물 운송 분야에서도 수익성을 유지할 수 있게 됩니다. 그 결과, 화학제품 물류 시장에서는 수익원이 운송량에서 정보, 리스크 관리, 고객 맞춤형 서비스로 전환되고 있습니다.
석유 및 가스 부문은 정유시설에서 석유화학 공장으로의 물류 흐름이 정착되어 있어 2025년 화학제품 물류 시장 규모의 30.57%를 차지하고 있지만, 성장 정체로 인해 공급업체들은 가격 압박에 직면해 있습니다. 특수 화학제품 부문은 리튬 이온 배터리용 전해액 및 의약품 중간체가 정밀한 취급, 보관 이력 기록, 그리고 온도 조절된 환경을 필요로 하기 때문에 연평균 성장률(CAGR) 6.72%가 예상됩니다. 아르곤 국립연구소의 예측에 따르면, 2030년까지 배터리 등급 전해액의 생산량은 1,300 GWh를 초과할 것이며, 습도가 관리되는 탱크 컨테이너에 대한 수요가 수배 증가할 것으로 전망됩니다.
의약품 및 화장품의 운송은 GDP(적정 유통 기준) 및 GMP(적정 제조 기준) 규정에 따라 인증된 보관 및 추적 가능한 운송이 의무화되어 있어, 수익의 안정성을 가져다주고 기준을 준수하는 운송업체에 가격 결정권을 부여하고 있습니다. 화장품 원료가 식물 추출물로 전환됨에 따라 소량·고빈도의 운송 경로가 생겨나고 있습니다. 이는 벌크 탱커 선단에는 적합하지 않지만, ISO 탱크의 이동이나 지역 디포 네트워크에는 이상적입니다. 따라서 화학제품 물류 시장은 낮은 마진을 보이는 범용 화물 물류와 차별화된 전문 지식을 필요로 하는 고부가가치 특수 틈새 시장이 공존하는 양극화된 성장 국면에 직면해 있습니다.
지역별 분석
아시아태평양은 2025년에 전 세계 매출의 39.21%를 차지하며, 2031년까지 연평균 성장률(CAGR) 6.31%로 성장할 전망입니다. 중국의 과잉 수출 생산 능력이 아시아 역내 무역을 촉진하고 화물을 인도 및 동남아시아로 우회시키고 있기 때문에 항만, 전용 화물 회랑, 연안 해운이 융합된 새로운 복합 운송 경로가 생겨나고 있습니다. 인도의 PCPIR 클러스터는 서해안 및 동해안을 따라 위치한 통합 복합 시설의 핵심 역할을 담당하고 있지만, 내륙 지역 수요 증가에 따라 국내 도로 및 철도 구간이 연장되면서 ISO 탱크 재배치 서비스에 대한 수요가 증가하고 있습니다.
북미와 유럽은 광범위한 철도망, 엄격한 안전 기준, 높은 디지털화율에 힘입어 여전히 주요 시장으로서의 지위를 유지하고 있습니다. 유럽의 ADR 및 CLP 규정 개정에 따라 차량 교체와 디지털 라벨 도입이 요구되고 있으며, 화주들은 인증된 공급업체와 장기 계약을 체결하도록 권장받고 있습니다. 북미에서는 멕시코만 연안의 석유화학 단지와 중서부 지역의 소비자를 연결하는 통합 철도 회랑이 비용 효율성이 뛰어나고 저탄소 운송 수단을 제공하여, 트랜스로드 터미널을 소유한 사업자에게 유리하게 작용하고 있습니다.
남미와 아프리카에는 성장 여지가 있지만, 인프라 부족으로 인해 그 가능성은 제한적입니다. 라고스, 더반, 몸바사에서 항만 체류 시간이 길어짐에 따라 재고 비용이 상승하고, 운송업체들은 완충 재고를 확보할 수밖에 없는 상황입니다. 아프리카 대륙 자유무역지대(AfCFTA)는 통관 절차의 조화를 목표로 하고 있지만, 과도기 동안의 단절된 상황으로 인해 각국 고유의 전문 지식과 현지 기반의 파트너십이 필수적입니다. 이러한 과제가 존재함에도 불구하고, 라틴아메리카의 니어쇼어링 추세로 인해 화학 제조업체들은 중간 가공 단계를 미국 구매자 근처로 이전해야 하는 압박을 받고 있으며, 이로 인해 이중 언어를 구사하는 직원과 통관업자 네트워크를 보유한 사업자들에게는 운송 회랑 개발이 촉진되고 있습니다.
기타 혜택:
- 엑셀 형식 시장 예측(ME) 시트
- 3개월간의 애널리스트 지원
자주 묻는 질문
목차
제1장 서론
제2장 조사 방법
제3장 주요 요약
제4장 시장 구도
제5장 시장 규모와 성장 예측
제6장 경쟁 구도
제7장 시장 기회와 향후 전망
JHS 26.08.28According to Mordor Intelligence, the chemical logistics market size is estimated at USD 534.37 billion in 2026, and is expected to reach USD 683.28 billion by 2031, at a CAGR of 5.04% during the forecast period (2026-2031).
This report is Segmented by Service Type (Transportation, Warehousing, and More), by End-User Industry (Pharmaceutical, Cosmetics, Oil & Gas, Specialty Chemicals, and More), by Hazard Class (Hazardous, Non-Hazardous), by Temperature Control (Temperature-Controlled, Non-Temperature-Controlled), by Geography (North America, Europe, and More). The Market Forecasts are Provided in Terms of Value (USD).
Global Chemical Logistics Market Trends and Insights
Expansion of Asian Chemical Production Boosting Long-haul Volumes
India's PCPIR zones and mainland China's capacity additions have shifted export lanes toward Europe and North America, lengthening voyage distances and raising ton-mile demand. Post-Red Sea routing changes have further extended typical Asia-Europe transits, supporting vessel-utilization and intermodal opportunities across rail-sea corridors. Government incentives in India are concentrating output in coastal clusters, yet inland consumption patterns are forcing longer domestic hauls that reward operators with integrated rail, road, and barge solutions.
Rising Use of Multimodal Networks for Hazardous Goods Cost & Safety
Sea-rail systems cut greenhouse-gas emissions by 81% and logistics costs by 70% versus road-only haulage, but adoption hinges on seamless regulatory alignment at modal junctions. The US Federal Railroad Administration highlights dual-mode locomotives and intermittent electrification as cost-effective for bulk chemical corridors when supported by utility partnerships. European operators such as Bertschi already avoid 300,000 tons of CO2 annually through integrated terminals that synchronize rail, barge, and road legs
High Capex-heavy Asset & Insurance Requirements
Stainless-steel ISO tanks, temperature-controlled chassis, and explosion-proof warehouses cost 2-3 times more than general-cargo equivalents. Peacock Container's USD 350 million sustainability-linked facility extension underlines the scale of capital required for fleet renewal. Insurance premiums now absorb up to 5% of revenue for dangerous-goods hauls, magnifying entry barriers.
Other drivers and restraints analyzed in the detailed report include:
- Regulatory Push for Safer, Greener Logistics Assets & Practices
- Outsourcing of Supply-chain Functions to 3PL/4PL Specialists
- Fragmented Multi-jurisdiction Compliance Burdens
For complete list of drivers and restraints, kindly check the Table Of Contents.
Segment Analysis
Transportation retained 65.14% of the chemical logistics market share in 2025 because physical movement remains unavoidable. Yet Other Services, covering blending, compliance management, and orchestration platforms, are forecast to grow at a 6.41% CAGR, reflecting shipper demand for one-stop solutions that reduce administrative burden. Value-added warehousing anchors working-capital programs by positioning inventory near consumption hubs, while digital platforms capture data exhaust that underpins predictive scheduling and emission reporting. DHL's acquisition of CryoPDP added 600,000 temperature-sensitive shipments annually, demonstrating how tuck-ins can accelerate capability expansion.
Second-generation 4PL models monetize orchestration by bundling carrier procurement, control-tower analytics, and compliance documentation in subscription packages. As shippers embed these APIs into enterprise resource planning systems, switching costs rise, allowing logistics providers to defend margins even in commodity haulage. Consequently, the chemical logistics market is witnessing a migration of profit pools from tonnage toward information, risk management, and near-customer customization.
Oil & Gas held 30.57% of the chemical logistics market size in 2025 due to entrenched refinery-to-petrochemical flows, but its low growth exposes providers to price pressure. Specialty Chemicals is slated for a 6.72% CAGR as lithium-ion battery electrolytes and pharmaceutical intermediates demand precision handling, chain-of-custody records, and temperature-stable environments. Argonne National Laboratory projects battery-grade electrolyte output to exceed 1,300 GWh by 2030, multiplying demand for moisture-controlled tank containers.
Pharmaceutical and cosmetics traffic supplies revenue stability because GDP or GMP protocols mandate certified storage and tracked transportation, giving compliant carriers pricing power. Cosmetics raw-materials shifts toward botanical extracts create small-lot, high-frequency lanes that are unsuitable for bulk tanker fleets but ideal for ISO tank relocation and regional depot networks. Thus, the chemical logistics market faces bifurcated growth where low-margin commodity flows coexist with high-service specialty niches requiring differentiated expertise.
Complete Report Scope:
- By Service
- Transportation
- Road
- Rail
- Sea/Ocean
- Air
- Warehousing, Distribution & Inventory Management
- Other Services
- Transportation
- By End-user Industry
- Pharmaceutical
- Cosmetics & Personal Care
- Oil & Gas
- Specialty Chemicals
- Other End-users
- By Hazard Class
- Hazardous Chemicals
- Non-hazardous Chemicals
- By Temperature Control
- Temperature-Controlled (Refrigerated/Heated)
- Non-Temperature-Controlled
- By Geography
- North America
- United States
- Canada
- Mexico
- South America
- Brazil
- Peru
- Chile
- Argentina
- Rest of South America
- Asia-Pacific
- India
- China
- Japan
- Australia
- South Korea
- South East Asia (Singapore, Malaysia, Thailand, Indonesia, Vietnam, Philippines)
- Rest of Asia-Pacific
- Europe
- United Kingdom
- Germany
- France
- Spain
- Italy
- BENELUX (Belgium, Netherlands, Luxembourg)
- NORDICS (Denmark, Finland, Iceland, Norway, Sweden)
- Rest of Europe
- Middle East and Africa
- United Arab Emirates
- Saudi Arabia
- South Africa
- Nigeria
- Rest of Middle East and Africa
- North America
Geography Analysis
Asia-Pacific accounted for 39.21% of global revenue in 2025 and will expand at a 6.31% CAGR through 2031. China's export overcapacity is propelling intra-Asian trade and rerouting cargo toward India and Southeast Asia, creating fresh multimodal lanes where ports, dedicated freight corridors, and coastal shipping converge. India's PCPIR clusters anchor integrated complexes along the western and eastern seaboards, but inland demand growth is extending domestic road-rail legs, amplifying demand for ISO-tank repositioning services.
North America and Europe remain premium markets, underpinned by extensive rail networks, strict safety rules, and high digital-adoption rates. Revised ADR and CLP frameworks in Europe require upgraded fleets and digital labels, encouraging shippers to lock in long-term contracts with certified providers. In North America, integrated rail corridors linking Gulf-Coast petrochemical complexes to Midwest consumers provide cost-effective, low-emission options that favor operators owning trans-load terminals.
South America and Africa offer upside tempered by infrastructure gaps. Prolonged port dwell times in Lagos, Durban, and Mombasa inflate inventory costs and compel carriers to build buffer stocks. The African Continental Free Trade Area aspires to harmonize customs procedures, but interim fragmentation necessitates country-specific expertise and localized partnerships. Despite these hurdles, nearshoring trends in Latin America are driving chemical manufacturers to relocate intermediate-processing stages closer to US buyers, stimulating corridor development for providers with bilingual staff and customs-broker networks.
- DHL Supply Chain
- Kuehne + Nagel International AG
- Maersk Logistics & Services
- HOYER Group
- C.H. Robinson Worldwide
- BDP International
- DSV (incl. DB Schenker)
- Rhenus SE & Co. KG
- A&R Logistics (Quantix)
- CEVA Logistics (Acquired by CMA CGM)
- Al-Futtaim Logistics
- Petrochem Middle East (PME)
- Sinotrans Chemical Logistics
- Bertschi AG
- Suttons Group
- Den Hartogh Logistics
- Brenntag Logistics Services
- MOL Chemical Tankers
- Stolt-Nielsen Ltd.
- Katoen Natie N.V.
- Toll Group
- Yusen Logistics Co., Ltd. (Nippon Yusen Group)
- Hellmann Worldwide Logistics SE & Co. KG*
Additional Benefits:
- The market estimate (ME) sheet in Excel format
- 3 months of analyst support
TABLE OF CONTENTS
1 Introduction
- 1.1 Study Assumptions & Market Definition
- 1.2 Scope of the Study
2 Research Methodology
3 Executive Summary
4 Market Landscape
- 4.1 Market Overview
- 4.2 Market Drivers
- 4.2.1 Expansion of Asian chemical production boosting long-haul volumes
- 4.2.2 Rising use of multimodal networks for hazardous-goods cost & safety
- 4.2.3 Regulatory push for safer, greener logistics assets & practices
- 4.2.4 Outsourcing of supply-chain functions to 3PL/4PL specialists
- 4.2.5 Low-carbon methanol & bio-based chains spawning new corridors
- 4.2.6 AI-driven visibility & digital-twin platforms enabling real-time compliance
- 4.3 Market Restraints
- 4.3.1 High capex-heavy asset & insurance requirements
- 4.3.2 Fragmented multi-jurisdiction compliance burdens
- 4.3.3 Fuel-price volatility compressing operator margins
- 4.3.4 Shortage of certified hazmat drivers in emerging markets
- 4.4 Value / Supply-Chain Analysis
- 4.5 Technological Innovations in the Industry
- 4.6 Government Regulations and Policies
- 4.7 Porter's Five Forces
- 4.7.1 Threat of New Entrants
- 4.7.2 Bargaining Power of Buyers/Consumers
- 4.7.3 Bargaining Power of Suppliers
- 4.7.4 Threat of Substitute Services (In-house Logistics)
- 4.7.5 Intensity of Competitive Rivalry
- 4.8 Impact of Geopolitical Events on the Market
5 Market Size & Growth Forecasts (Value)
- 5.1 By Service
- 5.1.1 Transportation
- 5.1.1.1 Road
- 5.1.1.2 Rail
- 5.1.1.3 Sea/Ocean
- 5.1.1.4 Air
- 5.1.2 Warehousing, Distribution & Inventory Management
- 5.1.3 Other Services
- 5.1.1 Transportation
- 5.2 By End-user Industry
- 5.2.1 Pharmaceutical
- 5.2.2 Cosmetics & Personal Care
- 5.2.3 Oil & Gas
- 5.2.4 Specialty Chemicals
- 5.2.5 Other End-users
- 5.3 By Hazard Class
- 5.3.1 Hazardous Chemicals
- 5.3.2 Non-hazardous Chemicals
- 5.4 By Temperature Control
- 5.4.1 Temperature-Controlled (Refrigerated/Heated)
- 5.4.2 Non-Temperature-Controlled
- 5.5 By Geography
- 5.5.1 North America
- 5.5.1.1 United States
- 5.5.1.2 Canada
- 5.5.1.3 Mexico
- 5.5.2 South America
- 5.5.2.1 Brazil
- 5.5.2.2 Peru
- 5.5.2.3 Chile
- 5.5.2.4 Argentina
- 5.5.2.5 Rest of South America
- 5.5.3 Asia-Pacific
- 5.5.3.1 India
- 5.5.3.2 China
- 5.5.3.3 Japan
- 5.5.3.4 Australia
- 5.5.3.5 South Korea
- 5.5.3.6 South East Asia (Singapore, Malaysia, Thailand, Indonesia, Vietnam, Philippines)
- 5.5.3.7 Rest of Asia-Pacific
- 5.5.4 Europe
- 5.5.4.1 United Kingdom
- 5.5.4.2 Germany
- 5.5.4.3 France
- 5.5.4.4 Spain
- 5.5.4.5 Italy
- 5.5.4.6 BENELUX (Belgium, Netherlands, Luxembourg)
- 5.5.4.7 NORDICS (Denmark, Finland, Iceland, Norway, Sweden)
- 5.5.4.8 Rest of Europe
- 5.5.5 Middle East and Africa
- 5.5.5.1 United Arab Emirates
- 5.5.5.2 Saudi Arabia
- 5.5.5.3 South Africa
- 5.5.5.4 Nigeria
- 5.5.5.5 Rest of Middle East and Africa
- 5.5.1 North America
6 Competitive Landscape
- 6.1 Market Concentration
- 6.2 Strategic Moves
- 6.3 Market Share Analysis
- 6.4 Company Profiles (includes Global level Overview, Market level overview, Core Segments, Financials as available, Strategic Information, Market Rank/Share for key companies, Products & Services, and Recent Developments)
- 6.4.1 DHL Supply Chain
- 6.4.2 Kuehne + Nagel International AG
- 6.4.3 Maersk Logistics & Services
- 6.4.4 HOYER Group
- 6.4.5 C.H. Robinson Worldwide
- 6.4.6 BDP International
- 6.4.7 DSV (incl. DB Schenker)
- 6.4.8 Rhenus SE & Co. KG
- 6.4.9 A&R Logistics (Quantix)
- 6.4.10 CEVA Logistics (Acquired by CMA CGM)
- 6.4.11 Al-Futtaim Logistics
- 6.4.12 Petrochem Middle East (PME)
- 6.4.13 Sinotrans Chemical Logistics
- 6.4.14 Bertschi AG
- 6.4.15 Suttons Group
- 6.4.16 Den Hartogh Logistics
- 6.4.17 Brenntag Logistics Services
- 6.4.18 MOL Chemical Tankers
- 6.4.19 Stolt-Nielsen Ltd.
- 6.4.20 Katoen Natie N.V.
- 6.4.21 Toll Group
- 6.4.22 Yusen Logistics Co., Ltd. (Nippon Yusen Group)
- 6.4.23 Hellmann Worldwide Logistics SE & Co. KG*
7 Market Opportunities & Future Outlook
- 7.1 White-space & Unmet-need Assessment


