

|
시장보고서
상품코드
2123300
인도의 시설 관리 시장 : 점유율 분석, 업계 동향과 통계, 성장 예측(2026-2031년)India Facility Management - Market Share Analysis, Industry Trends & Statistics, Growth Forecasts (2026 - 2031) |
||||||
 Mordor Intelligence
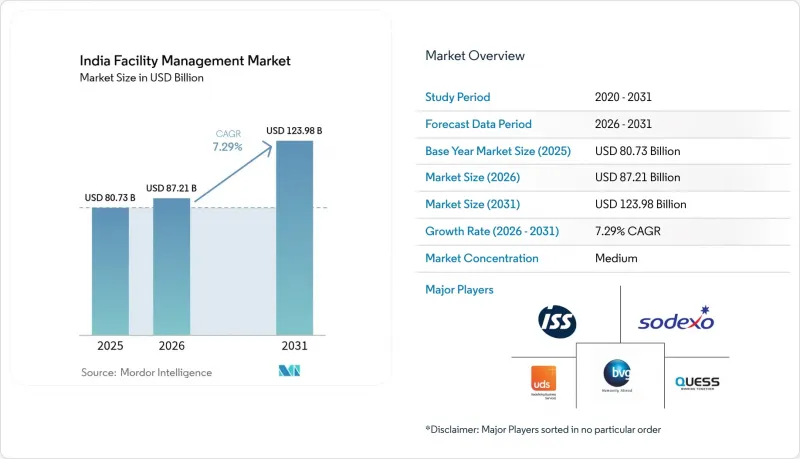
Mordor Intelligence에 의하면, 인도 시설 관리 시장 규모는 2026년 872억 1,000만 달러에서 2031년까지 1,239억 8,000만 달러에 이를 것으로 예상되고 있어 2026년부터 2031년까지 CAGR 7.29%로 성장할 전망입니다.
본 보고서는 서비스 유형(하드 서비스(자산 관리 등), 소프트 서비스(사무 지원·보안 등)), 제공 형태(사내 제공, 외부 위탁(단일 FM, 번들형 FM 등)), 최종 사용자 산업(상업, 호스피탈리티, 공공·인프라, 산업·공정 등)별로 분류되어 있습니다. 시장 예측은 금액(달러) 기준으로 제시되어 있습니다.
인도 시설 관리 시장 동향 및 인사이트력
상업용 부동산의 급속한 확대
개발업자들은 2025년 중 7,900만 평방피트가 넘는 A급 오피스를 준공하여 방갈로르, 하이데라바드, 푸네의 공실률을 13% 미만으로 억제했습니다. 신축 건물의 사양에는 스마트 계량기, LEED 또는 IGBC 인증, 그리고 ‘2016년 국가 건축 기준법’을 준수하는 소방 시스템의 도입이 요구됩니다. 이에 따라 시설 관리자는 24시간 체제의 공조(HVAC) 최적화, 정기적인 화재 예방 점검, 그리고 가동 중단 시간을 최소화하기 위한 예측 분석을 담당하고 있습니다. 유연한 업무 공간 사업자들은 주요 마이크로 마켓에서 공급 능력을 확대하여 일일 가동률에 변동을 가져왔습니다. 이에 따라 재실감지 센서 및 공간 이용률 대시보드의 활용이 촉진되고 있습니다. 이러한 동향들이 맞물리면서 하드 및 소프트 서비스를 결합한 계약이 임대인의 전략에서 최우선 과제가 되고 있습니다. 기계 설비, 청소, 경비, 에너지 서비스를 통합하여 실적 연동형 요금 체계로 제공할 수 있는 사업자는 장기 임대 계약을 확보하고 더 높은 수익률을 실현하고 있습니다.
기술 통합, IoT, AI 및 자동화
현재 IoT 센서는 5억제곱피트가 넘는 상업 및 산업용 공간에서 온도, 진동, 전력을 추적하고 있으며, 이 데이터는 클라우드 플랫폼으로 전송되어 고장이 발생하기 훨씬 전에 이상을 감지하고 있습니다. 인공지능(AI) 도구는 과거 작업 지시서 및 자산의 텔레메트리 데이터를 평가하여, 예기치 않은 가동 중단 시간을 최대 30%까지 줄이는 유지보수 개입을 가능하게 합니다. 디지털 트윈은 개보수 공사나 재생에너지 도입을 시뮬레이션하여 설비 투자 의사 결정을 지원합니다. 인도 증권거래위원회(SEBI)는 상위 1,000개 상장 기업에 에너지 사용 데이터 공개를 요구했습니다. 이에 따라 고객들은 실시간 대시보드를 점점 더 많이 요구하고 있습니다. 빌딩 관리 소프트웨어와 전사적 자원 관리(ERP) 플랫폼을 연동할 수 있는 서비스 제공업체는 경쟁 우위를 확보할 수 있습니다.
인력 부족과 기술 격차
2025년, 대도시권의 청소 및 경비 부문 이직률은 40%를 넘어섰습니다. 이는 근로자들이 전자상거래나 긱 경제 플랫폼으로 유출되었기 때문입니다. 기술직 분야에서는 더욱 심각한 인력 부족 현상이 나타나고 있습니다. 직업 훈련 기관을 졸업하는 HVAC(공조·환기·냉난방) 및 BMS(빌딩 관리 시스템) 기술자는 5만 명 미만인 반면, 연간 수요는 15만 명에 달할 전망입니다. 이에 따라 서비스 제공업체들은 교육 기관이나 견습 프로그램을 운영하고 있지만, 이로 인해 채용 비용이 증가하고 업무 시작까지의 기간이 길어지고 있습니다. 계약에 자동 가격 조정 조항이 포함되어 있지 않은 경우, 10%-12%의 임금 인상이 이익률을 압박합니다. 일부 기업은 현장 인력 감축을 목적으로 원격 모니터링을 시범 도입하고 있지만, 규제 및 고객이 현장 상주를 선호하는 경향으로 인해 그 규모 확대에는 여전히 제약이 있습니다.
부문별 분석
하드 서비스는 인도 시설 관리 시장 전체보다 빠른 성장을 보였으며, 법규 준수 의무 및 에너지 절약 개보수 덕분에 연평균 성장률(CAGR) 8.37%로 성장할 전망입니다. ‘2016년 국가건축기준법’은 고층 빌딩에 화재 감지 및 소화 설비의 설치를 의무화하고 있으며, 이로 인해 노후된 건물군 전반에 걸쳐 개보수 프로그램이 촉진되고 있습니다. 에너지 효율국(BEE)의 기준은 칠러 교체 및 가변 주파수 드라이브 도입을 권장하고 있으며, 이를 통해 전력 소비를 최대 35%까지 절감할 수 있습니다. 그 결과, 기관 투자자인 부동산 소유주들은 상태 모니터링 시스템을 도입하여 인도 시설 관리 시장 규모에 뒷받침된 안정적이고 지속적인 수익을 창출하고 있습니다.
일상적인 청소, 사무 지원, 경비 등의 소프트 서비스는 2025년 수익의 66.52%를 계속 차지하고 있습니다. 그러나 특히 새로운 A급 사무실에서 출입 통제 및 영상 분석이 보급됨에 따라 유인 경비 초소는 감소하고 있으며, 경비원 배치 밀도는 3분의 1 가까이까지 낮아졌습니다. 청소 업무는 높은 단가를 기대할 수 있는 로프 액세스를 이용한 외벽 공사나 준공 후 철저한 청소로 전환되고 있습니다. 케이터링 사업에서는 웰니스 목표를 달성하기 위해 메뉴의 디지털화와 폐기물 추적이 이루어지고 있습니다. 시장의 세분화가 지속되며 규모의 경제가 제약받고 있지만, 틈새 시장 사업자들은 전문적인 소독이나 리넨 살균 분야에서 이익을 올리고 있습니다.
기타 혜택:
- 엑셀 형식 시장 예측(ME) 시트
- 3개월간의 애널리스트 지원
자주 묻는 질문
목차
제1장 서론
제2장 조사 방법
제3장 주요 요약
제4장 시장 구도
제5장 시장 규모와 성장 예측
제6장 경쟁 구도
제7장 시장 기회와 향후 전망
JHS 26.09.07According to Mordor Intelligence, the India facility management market size is expected to increase from USD 87.21 billion in 2026 to reach USD 123.98 billion by 2031, growing at a CAGR of 7.29% over 2026-2031.
This report is Segmented by Service Type (Hard Services [Asset Management, and More], and Soft Services [Office Support and Security, and More]), Offering Type (In-House, and Outsourced [Single FM, Bundled FM, and More]), and End-User Industry (Commercial. Hospitality, Institutional and Public Infrastructure, Industrial and Process, and More). The Market Forecasts are Provided in Terms of Value (USD).
India Facility Management Market Trends and Insights
Rapid Commercial Real Estate Expansion
Developers completed more than 79 million sq ft of Grade A offices during 2025, keeping Bengaluru, Hyderabad and Pune below 13% vacancy. New-build specifications call for smart meters, LEED or IGBC certification and fire-safety systems aligned with the National Building Code 2016. Facility managers therefore handle round-the-clock HVAC optimization, periodic fire-audits and predictive analytics that minimize downtime. Flexible workspace operators added capacity in core micro-markets, creating variable daily occupancy that drives use of occupancy sensors and space-utilization dashboards. Collectively, these trends push bundled hard-and-soft contracts to the forefront of landlord strategy. Providers that can integrate mechanical, cleaning, security and energy services under performance-linked fees win longer tenures and higher margins.
Technology Integration, IoT, AI and Automation
IoT sensors now track temperature, vibration and power in more than 500 million sq ft of commercial and industrial space, feeding cloud platforms that flag anomalies well before failure. Artificial intelligence tools evaluate historical work orders and asset telemetry, enabling maintenance interventions that cut unplanned downtime by up to 30%. Digital twins simulate refurbishments and renewable-energy additions to guide capex decisions. The Securities and Exchange Board of India (SEBI) asked the top 1,000 listed firms to disclose energy-use data, so clients can increasingly demand real-time dashboards. Service providers able to connect building-management software with enterprise resource planning platforms gain competitive insulation.
Labour Shortages and Skill Gaps
Metro attrition in housekeeping and guarding exceeded 40% in 2025 as workers jumped to e-commerce and gig platforms. Technical trades show deeper deficits: vocational institutes graduate fewer than 50,000 HVAC and BMS technicians against 150,000 annual demand. Providers therefore run academies and apprenticeship programs, lifting recruitment costs and elongating ramp-up times. Wage inflation of 10%-12% compresses margins when contracts lack automatic escalation clauses. Some firms pilot remote monitoring to cut site headcount, but regulations and client preferences for physical presence still limit scale.
Other drivers and restraints analyzed in the detailed report include:
- Increasing Outsourcing Trend
- Hygiene and Health Compliance Mandates
- Margin Pressure from Rising Operational Costs
For complete list of drivers and restraints, kindly check the Table Of Contents.
Segment Analysis
Hard services generated faster growth than the overall India facility management market, expanding at an 8.37% CAGR thanks to mandatory compliance and energy-saving retrofits. The National Building Code 2016 obliges fire-detection and suppression in high-rise assets, spurring retrofit programs across older stock. Bureau of Energy Efficiency (BEE) codes encourage chiller replacement and variable-frequency drives that trim consumption by up to 35%. Consequently, institutional landlords deploy condition-based monitoring suites, creating sticky recurring revenue anchored to the India facility management market size.
Soft services still delivered 66.52% of 2025 revenue by virtue of daily cleaning, office support and guarding. However, manned-security posts are falling as access control and video analytics spread, particularly in new Grade A offices, reducing guard density by almost one-third. Cleaning moves toward rope-access facade works and post-construction deep cleans that command premiums. Catering digitizes menus and tracks waste to satisfy wellness targets. Fragmentation persists, constraining economies of scale, but niche operators carve profit in specialized disinfection or linen sterilization.
Complete Report Scope:
- By Service Type
- Hard Services
- Asset Management
- MEP and HVAC Services
- Fire Systems and Safety
- Other Hard Facility Management Services
- Soft Services
- Office Support and Security
- Cleaning Services
- Catering Services
- Other Soft Facility Management Services
- Hard Services
- By Offering Type
- In-house
- Outsourced
- Single Facility Management
- Bundled Facility Management
- Integrated Facility Management
- By End-User Industry
- Commercial
- Hospitality
- Institutional and Public Infrastructure
- Healthcare (Public Facilities, Private Facilities)
- Industrial and Process
- Other End-User Industries
List of Companies Covered in this Report:
- ISS Facility Management
- Sodexo Facilities Management Services India Pvt. Ltd.
- Quess Corporation
- Updater Services Pvt. Ltd.
- BVG India Ltd.
- Dusters Total Solutions Ltd.
- EFS Facilities Services
- G4S India
- Mortice Group PLC (TenonFM)
- ServiceMax Facility Management Pvt. Ltd.
- Knight Frank India
- Avon Facility Management Services Pvt. Ltd.
- Kleen Tek Solutions
- DTSS Facility Services
- Tenon Facility Management Pvt. Ltd.
- CBRE South Asia Pvt. Ltd.
- JLL Integrated Facilities Management
- Cushman and Wakefield Facilities Services India
- Colliers India
- Johnson Controls India
Additional Benefits:
- The market estimate (ME) sheet in Excel format
- 3 months of analyst support
TABLE OF CONTENTS
1 INTRODUCTION
- 1.1 Study Assumptions and Market Definition
- 1.2 Scope of the Study
2 RESEARCH METHODOLOGY
3 EXECUTIVE SUMMARY
4 MARKET LANDSCAPE
- 4.1 Market Overview
- 4.1.1 Current Occupancy Rates
- 4.1.2 Profitability Rates of Major FM Players
- 4.1.3 Workforce Indicators, Labor Participation
- 4.1.4 Facility Management Market Share (%) by Service Type
- 4.1.5 Facility Management Market Share (%) by Hard Services
- 4.1.6 Facility Management Market Share (%) by Soft Services
- 4.1.7 Urbanization and Population Growth in Major Metros
- 4.1.8 Sector Investment Priorities in National Infrastructure Pipeline
- 4.1.9 Regulatory Drivers Specific to Labor and Safety Standards
- 4.2 Market Drivers
- 4.2.1 Rapid Commercial Real Estate Expansion
- 4.2.2 Technology Integration, IoT, AI, and Automation
- 4.2.3 Increasing Outsourcing Trend
- 4.2.4 Hygiene and Health Compliance Mandates
- 4.2.5 Uptake of Outcome-Based FM Contracts in Tier-2 Cities
- 4.2.6 ESG-Linked Lending Driving Green Facility Upgrades
- 4.3 Market Restraints
- 4.3.1 Labor Shortages and Skill Gaps
- 4.3.2 Margin Pressure from Rising Operational Costs
- 4.3.3 High Client Price Sensitivity and Fragmented Procurement Practices
- 4.3.4 Smart-Building Automation Reducing Manned-Guarding Demand
- 4.4 Industry Value Chain Analysis
- 4.5 Regulatory Landscape
- 4.6 PESTEL Analysis
- 4.7 Porter's Five Forces Analysis
- 4.7.1 Bargaining Power of Suppliers
- 4.7.2 Bargaining Power of Buyers
- 4.7.3 Threat of New Entrants
- 4.7.4 Threat of Substitute Services
- 4.7.5 Intensity of Competitive Rivalry
- 4.8 Impact of Macroeconomic Factors on the Market
- 4.9 Investment and Funding Analysis
5 MARKET SIZE AND GROWTH FORECASTS (VALUE)
- 5.1 By Service Type
- 5.1.1 Hard Services
- 5.1.1.1 Asset Management
- 5.1.1.2 MEP and HVAC Services
- 5.1.1.3 Fire Systems and Safety
- 5.1.1.4 Other Hard Facility Management Services
- 5.1.2 Soft Services
- 5.1.2.1 Office Support and Security
- 5.1.2.2 Cleaning Services
- 5.1.2.3 Catering Services
- 5.1.2.4 Other Soft Facility Management Services
- 5.1.1 Hard Services
- 5.2 By Offering Type
- 5.2.1 In-house
- 5.2.2 Outsourced
- 5.2.2.1 Single Facility Management
- 5.2.2.2 Bundled Facility Management
- 5.2.2.3 Integrated Facility Management
- 5.3 By End-User Industry
- 5.3.1 Commercial
- 5.3.2 Hospitality
- 5.3.3 Institutional and Public Infrastructure
- 5.3.4 Healthcare (Public Facilities, Private Facilities)
- 5.3.5 Industrial and Process
- 5.3.6 Other End-User Industries
6 COMPETITIVE LANDSCAPE
- 6.1 Market Concentration
- 6.2 Strategic Moves
- 6.3 Market Share Analysis
- 6.4 Company Profiles (includes Global Level Overview, Market Level Overview, Core Segments, Financials as available, Strategic Information, Market Rank/Share, Products and Services, Recent Developments)
- 6.4.1 ISS Facility Management
- 6.4.2 Sodexo Facilities Management Services India Pvt. Ltd.
- 6.4.3 Quess Corporation
- 6.4.4 Updater Services Pvt. Ltd.
- 6.4.5 BVG India Ltd.
- 6.4.6 Dusters Total Solutions Ltd.
- 6.4.7 EFS Facilities Services
- 6.4.8 G4S India
- 6.4.9 Mortice Group PLC (TenonFM)
- 6.4.10 ServiceMax Facility Management Pvt. Ltd.
- 6.4.11 Knight Frank India
- 6.4.12 Avon Facility Management Services Pvt. Ltd.
- 6.4.13 Kleen Tek Solutions
- 6.4.14 DTSS Facility Services
- 6.4.15 Tenon Facility Management Pvt. Ltd.
- 6.4.16 CBRE South Asia Pvt. Ltd.
- 6.4.17 JLL Integrated Facilities Management
- 6.4.18 Cushman and Wakefield Facilities Services India
- 6.4.19 Colliers India
- 6.4.20 Johnson Controls India
7 MARKET OPPORTUNITIES AND FUTURE OUTLOOK
- 7.1 White-space and Unmet-Need Assessment
- 7.2 Technology-Led Integrated FM (IoT, BMS, AI-Based Predictive Maintenance)
- 7.3 ESG-Compliant FM Solutions Demand
- 7.4 Future Service-Model Shifts, Outcome-Based Contracts
- 7.5 Data-Driven Energy Optimization and Carbon Reporting Services


