|
시장보고서
상품코드
2125512
미국의 통신 MNO 시장 : 시장 점유율 분석, 업계 동향 및 통계, 성장 예측(2026-2031년)US Telecom MNO - Market Share Analysis, Industry Trends & Statistics, Growth Forecasts (2026 - 2031) |
||||||
 Mordor Intelligence
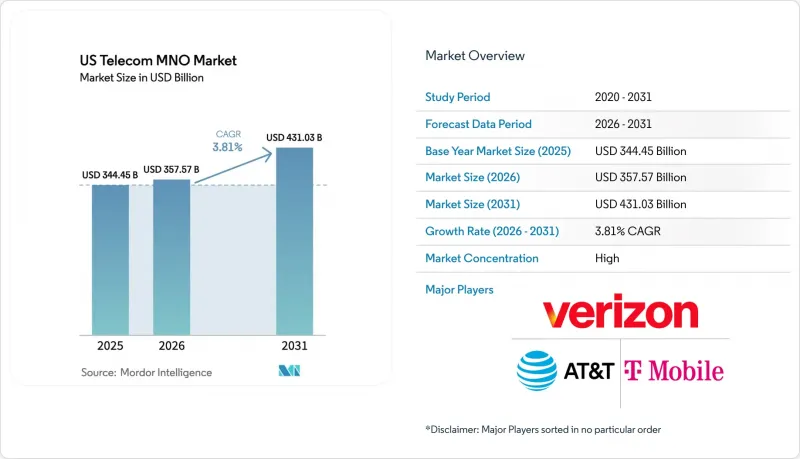
Mordor Intelligence에 의하면, 2026년 미국의 통신 MNO 시장 규모는 3,575억 7,000만 달러로 추정되며, 2025년 3,444억 5,000만 달러에서 확대해, 2031년에는 4,310억 3,000만 달러에 이를 것으로 예측됩니다.
2026-2031년 연평균 성장률(CAGR)은 3.81%를 나타낼 전망입니다.

본 보고서는 서비스 유형별(음성 서비스, 데이터·인터넷 서비스, 메시징 서비스, IoT·M2M 서비스, OTT·유료 TV 서비스, 기타 서비스) 및 최종 사용자별(기업, 소비자)로 분류되어 있습니다. 시장 예측은 금액(달러) 및 수량(가입자 수)의 관점에서 제시되어 있습니다.
미국의 통신 MNO 시장 동향 및 인사이트
5G 스탠드얼론(SA) 코어 도입이 데이터 수익화를 가속화
스탠드얼론(SA) 아키텍처로의 완전한 전환을 통해 통신 사업자는 지연 시간과 처리량을 보장하는 가상 슬라이스를 구축할 수 있게 되어, 기존의 비스탠드얼론(NSA) 방식으로는 실현할 수 없었던 서비스 차별화가 가능해집니다. T-Mobile은 이미 연간 2억 달러의 지속적 수익을 창출하고 있는 공공 안전용 슬라이스를 상용화한 반면, Verizon은 SA를 활용하여 제조용 로봇을 위한 10밀리초 미만의 엣지 워크로드를 지원하고 있습니다. 기업용 계약의 경우 API 공개가 세트로 제공되는 경우가 많으며, 이를 통해 개발자는 캐리어 등급의 인증 및 과금 기능을 용도에 직접 통합할 수 있습니다. 이는 2028년까지 약 200억 달러 규모의 플랫폼 수익원으로 이어질 전망입니다. 고부가가치 네트워크 슬라이스는 일반 모바일 브로드밴드의 ARPU의 3-5배에 달하며, 미국 이동통신MNO 시장을 직접적으로 견인하고 있습니다.
고정 무선 액세스(FWA)가 기존의 구리선 회선을 대체하고 있습니다.
2024년 말까지 국내 FWA 가입자 수는 1,000만 건을 돌파했습니다. 이는 미드밴드 및 C-band 주파수 대역을 통해 지방 마을에서 평균 300 Mbps의 다운링크 속도가 실현되었기 때문입니다. 이 서비스는 구형 DSL 및 동축 케이블 가입자 기반을 직접 대체하고, 광섬유 커버리지의 공백을 메우며, 통신 사업자의 5G 무선 장비에 대한 투자 회수를 가속화합니다. 또한, FWA는 가정용 번들 서비스 강화에도 기여하고 있으며, 가정용 인터넷 회선이 있는 경우 무선 통신 사업자가 모바일 회선을 추가하는 비율이 18% 높아집니다. 인구 밀도가 높은 교외 지역의 용량 제약으로 인해 능동 안테나 확장 및 주파수 공유 알고리즘 도입이 진행되고 있지만, 매설 공사와 비교해도 경제성은 여전히 양호합니다. 고객 수의 급속한 증가로 인해 2027년까지 미국 통신 MNO 시장의 연평균 성장률(CAGR)은 0.8포인트 상승할 것입니다.
선불 시장에서 인플레이션으로 인한 ARPU 압박
에너지비와 인건비 급등으로 인해 통신 사업자들은 요금제 인상을 피할 수 없게 되었지만, 선불 고객들은월요금이 5달러 이상 상승하면 즉시 해지하는 경향을 보입니다. AT&T의 2025년 요금 인상은 선불 계약 해지율을 일시적으로 190 베이시스 포인트 상승시켰고, 그 결과 고객 유지를 위한 크레딧 및 마케팅 비용 증가를 초래했습니다. 현재 통신 사업자들은 가입자 수를 유지하기 위해 컨텐츠가 포함된 번들 요금제, 대용량 데이터 요금제, ‘지금 구매·나중에 결제’ 방식의 단말기 할부 요금제를 확대하고 있으며, 이로 인해 단기적으로는 EBITDA 마진이 40-60 베이시스 포인트 축소될 것으로 보입니다.
부문별 분석
데이터·인터넷 부문은 2025년 매출의 53.12%를 차지했으며, 미국의 통신 MNO 시장 규모에서 가장 큰 기여를 했습니다. 무제한 스마트폰 요금제, FWA(고정 무선 액세스) 계약, 기업 전용 액세스가 결합되어 사용자 1인당 모바일 데이터 트래픽은 전년 대비 7.8% 증가했습니다. 캐리어 애그리게이션을 활용한 프리미엄 요금제는 2025년 현장 테스트에서 5.5Gbps의 처리량을 달성하여 속도 면에서의 리더십에 대한 인식을 강화하고, 가격 차이의 정당성을 입증했습니다. OTT(Over-The-Top) 서비스로의 대체가 진행되며 이용량이 두 자릿수 감소함에 따라, 음성 및 SMS 매출 비중은 합산하여 10% 미만으로 떨어졌습니다. 한편, IoT·M2M 서비스는 3,000만 대의 라이선스 기반 셀룰러 엔드포인트 증가와 공장, 항만, 병원 내 프라이빗 네트워크 도입 사례의 급증에 힘입어 가장 빠른 성장 궤적을 기록했습니다. 이 하위 부문의 2031년까지 연평균 성장률(CAGR) 3.92%는 축소되는 기존 회선 사업을 상쇄하는 장기적인 성장 요인이 되어, 이를 통해 미국 통신 MNO 시장의 확대가 유지되고 있습니다.
기업용 데이터 계약에서는 SLA(서비스 수준 계약)에 기반한 처리량 및 네트워크 슬라이스 분리가 점점 더 요구되고 있으며, 이러한 요건은 일반 소비자용 회선보다 높은 이익률과 장기적인 계약을 가져옵니다. 도매 로밍 및 가상 통신 사업자(MVNO)와의 제휴는 매출 증대를 가져오는 한편, 주로 이용이 저조한 시간대의 주파수 자산 상각을 목적으로 합니다. 자체 최적화 네트워크에 통합된 고급 분석 기능을 통해 전력 소비가 약 15% 감소하며, 그 결과 절감된 운영 비용(OPEX)을 소규모 기지국 증설에 재투자할 수 있게 되어, 미국 통신 MNO 시장 전체에서 데이터 중심의 사업 전개가 더욱 강화됩니다.
기타 혜택 :
- 엑셀 형식 시장 예측(ME) 시트
- 3개월간의 애널리스트 지원
자주 묻는 질문
목차
제1장 서론
제2장 조사 방법
제3장 주요 요약
제4장 시장 구도
제5장 시장 규모 및 성장 예측
제6장 경쟁 구도
제7장 시장 기회 및 향후 전망
AJY 26.09.15According to Mordor Intelligence, US telecom MNO market size in 2026 is estimated at USD 357.57 billion, growing from 2025 value of USD 344.45 billion with 2031 projections showing USD 431.03 billion, growing at 3.81% CAGR over 2026-2031.
This report is Segmented by Service Type (Voice Services, Data and Internet Services, Messaging Services, Iot and M2M Services, OTT and PayTV Services, and Other Services), and End User (Enterprises, Consumer). The Market Forecasts are Provided in Terms of Value (USD) and Volume (Subscribers).
US Telecom MNO Market Trends and Insights
5G Stand-Alone Core Roll-outs Accelerating Data Monetization
Full migration to stand-alone (SA) architecture allows carriers to create virtual slices that guarantee latency and throughput, adding service differentiation unavailable on legacy non-stand-alone deployments. T-Mobile commercialized public-safety slices that already contribute USD 200 million in recurring annual revenue, while Verizon leverages SA to support sub-10 millisecond edge workloads for manufacturing robotics . Enterprise deals often bundle API exposure so developers can embed carrier-grade authentication and billing directly into applications, a pathway to an estimated USD 20 billion platform revenue pool by 2028 . Higher-value network slices translate into 3-5 times the ARPU of mass-market mobile broadband, directly lifting the US Telecom MNO market.
Fixed-Wireless Access (FWA) Displacing Legacy Copper
National FWA subscriptions crossed the 10 million mark by end-2024 as mid-band and C-band spectrum enabled 300 Mbps average downlink in rural clusters. The product directly cannibalizes outdated DSL and coax footprints, fills fiber coverage gaps, and accelerates operators' payback on 5G radios. FWA also strengthens household bundling, with wireless carriers attaching mobile lines at an 18% higher rate when a home internet account is present. Capacity constraints in dense suburbs trigger active-antenna expansions and spectrum-sharing algorithms, yet economics remain favorable relative to trenching. Rapid customer growth adds 0.8 percentage points to the US Telecom MNO market CAGR through 2027.
Inflation-Induced ARPU Pressure in Prepaid
Elevated energy and labor expenses compel carriers to raise plan prices, yet prepaid customers exhibit immediate churn when monthly bills climb by more than USD 5. AT&T's 2025 upward revisions triggered a temporary 190-basis-point increase in prepaid churn, forcing larger retention credits and marketing spend. Operators now extend inclusive content bundles, high-data allotments, and buy-now-pay-later device financing to defend subscriber counts, trimming EBITDA margin by 40-60 basis points over the near term.
Other drivers and restraints analyzed in the detailed report include:
- eSIM-Only Device Launches Simplifying Churn
- Federal BEAD and Middle-Mile Grants Stimulating Rural Build-outs
- Fiber Over-builds Eroding FWA Economics
For complete list of drivers and restraints, kindly check the Table Of Contents.
Segment Analysis
The data and internet category represented 53.12% of 2025 revenue, delivering the single-largest contribution to the US Telecom MNO market size. Unlimited smartphone plans, FWA subscriptions, and enterprise dedicated access collectively underpinned a 7.8% uplift in mobile data traffic per user year-on-year. Premium tiers exploiting carrier aggregation hit verified 5.5 Gbps throughput during 2025 field tests, reinforcing perceived speed leadership and justifying price differentials. Voice and SMS collectively fell below 10% revenue share as over-the-top substitutes drove double-digit usage declines. Meanwhile, IoT and M2M services posted the fastest trajectory, supported by 30 million incremental licensed cellular endpoints and a swelling pipeline of private network installs inside factories, ports, and hospitals. The sub-segment's 3.92% CAGR through 2031 adds a long-run lift that offsets eroding legacy lines, thereby sustaining expansion in the US Telecom MNO market.
Enterprise data contracts increasingly request SLA-backed throughput and network-slice isolation, commands that draw higher margins and longer-term commitments than consumer lines. Wholesale roaming and virtual operator partnerships add incremental revenue but primarily serve to amortize spectrum assets during off-peak hours. Advanced analytics embedded in self-optimizing networks slash power draw by around 15% and thereby release opex for reinvestment in additional small cells, further reinforcing data-centric positioning across the US Telecom MNO market.
Complete Report Scope:
- Overall Telecom Revenue and ARPU
- Service Type
- Voice Services
- Data and Internet Services
- Messaging Services
- IoT and M2M Services
- OTT and PayTV Services
- Other Services (VAS, Roaming and International Services, Enterprise and Wholesale Services, etc.)
- End-user
- Enterprises
- Consumer
List of Companies Covered in this Report:
- Verizon Communications Inc.
- AT&T Inc.
- T-Mobile US, Inc.
Additional Benefits:
- The market estimate (ME) sheet in Excel format
- 3 months of analyst support
TABLE OF CONTENTS
1 INTRODUCTION
- 1.1 Study Assumptions and Market Definition
- 1.2 Scope of the Study
2 RESEARCH METHODOLOGY
3 EXECUTIVE SUMMARY
4 MARKET LANDSCAPE
- 4.1 Market Overview
- 4.2 Regulatory and Policy Framework
- 4.3 Spectrum Landscape and Competitive Holdings
- 4.4 Telecom Industry Ecosystem
- 4.5 Macroeconomic and External Drivers
- 4.6 Porter's Five Forces Analysis
- 4.6.1 Competitive Rivalry
- 4.6.2 Threat of New Entrants
- 4.6.3 Bargaining Power of Suppliers
- 4.6.4 Bargaining Power of Buyers
- 4.6.5 Threat of Substitutes
- 4.7 Key MNO KPIs (2020-2025)
- 4.7.1 Unique Mobile Subscribers and Penetration Rate
- 4.7.2 Mobile Internet Users and Penetration Rate
- 4.7.3 SIM Connections by Access Technology and Penetration
- 4.7.4 Cellular IoT / M2M Connections
- 4.7.5 Broadband Connections (Mobile and Fixed)
- 4.7.6 ARPU (Average Revenue Per User)
- 4.7.7 Average Data Usage per Subscription (GB/month)
- 4.8 Market Drivers
- 4.8.1 5G Stand-Alone Core Roll-outs Accelerating Data-Monetization
- 4.8.2 Fixed-Wireless Access (FWA) Displacing Legacy Copper
- 4.8.3 eSIM-Only Device Launches Simplifying Churn
- 4.8.4 Federal BEAD and Middle-Mile Grants Stimulating Rural Build-outs
- 4.8.5 Private-Cellular Demand from IIoT and Campus Networks
- 4.8.6 AI-Driven RAN Optimization Lowering OPEX
- 4.9 Market Restraints
- 4.9.1 Inflation-Induced ARPU Pressure in Pre-paid
- 4.9.2 Fiber Over-builds Eroding FWA Economics
- 4.9.3 C-Band Aviation Mitigation Costs
- 4.9.4 Heightened FCC Scrutiny on MandA
- 4.10 Technological Outlook
- 4.11 Analysis of key business models in Telecom Sector
- 4.12 Analysis of Pricing Models and Pricing
5 MARKET SIZE AND GROWTH FORECASTS (VALUE)
- 5.1 Overall Telecom Revenue and ARPU
- 5.2 Service Type
- 5.2.1 Voice Services
- 5.2.2 Data and Internet Services
- 5.2.3 Messaging Services
- 5.2.4 IoT and M2M Services
- 5.2.5 OTT and PayTV Services
- 5.2.6 Other Services (VAS, Roaming and International Services, Enterprise and Wholesale Services, etc.)
- 5.3 End-user
- 5.3.1 Enterprises
- 5.3.2 Consumer
6 COMPETITIVE LANDSCAPE
- 6.1 Market Concentration
- 6.2 Strategic Moves and Investments by key vendors, 2023-2025
- 6.3 Market share analysis for MNOs, 2024
- 6.4 Product Benchmarking Analysis for mobile network services
- 6.5 MNO snapshot (subscribers, churn rate, ARPU, etc.)
- 6.6 Company Profiles* of MNOs (Includes Business Overview | Service Portfolio | Financials | Business Strategy and Recent Developments | SWOT Analysis)
- 6.6.1 Verizon Communications Inc.
- 6.6.2 AT&T Inc.
- 6.6.3 T-Mobile US, Inc.
7 MARKET OPPORTUNITIES AND FUTURE OUTLOOK
- 7.1 White-space and Unmet-Need Assessment