|
시장보고서
상품코드
2125548
말레이시아의 통신 MNO 시장 : 점유율 분석, 업계 동향과 통계, 성장 예측(2026-2031년)Malaysia Telecom MNO - Market Share Analysis, Industry Trends & Statistics, Growth Forecasts (2026 - 2031) |
||||||
 Mordor Intelligence
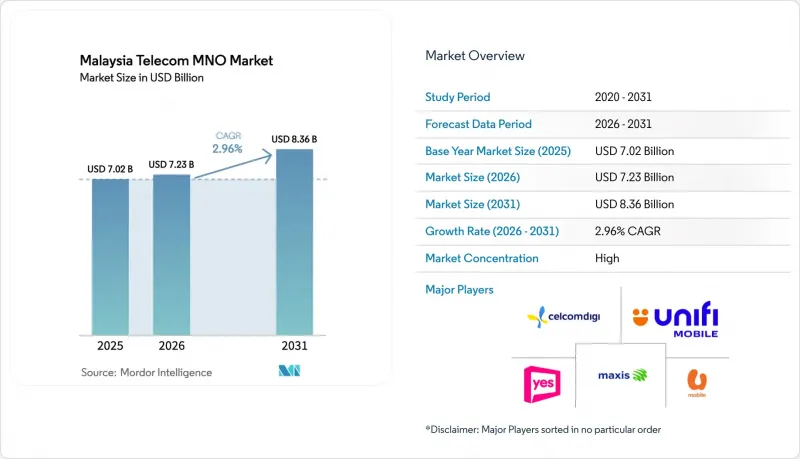
Mordor Intelligence에 의하면, 말레이시아 통신 MNO 시장 규모는 2025년에 70억 2,000만 달러로 평가되었고 2026년 72억 3,000만 달러에서 2031년까지 83억 6,000만 달러에 이를 것으로 예측되며, 예측 기간(2026-2031년) CAGR은 2.96%를 나타낼 전망입니다.
본 보고서는 서비스 유형(음성 서비스, 데이터·인터넷 서비스, 메시징 서비스, IoT·M2M 서비스, OTT·유료 TV 서비스 등) 및 최종 사용자(기업, 소비자)별로 분류되어 있습니다. 시장 전망은 금액(달러) 및 수량(가입자 수)의 관점에서 제시되어 있습니다.
말레이시아 통신 MNO 시장 동향 및 인사이트
JENDELA 및 듀얼 네트워크 모델에 기반한 5G 커버리지 확대
단일 도매 네트워크에서 경쟁적인 듀얼 네트워크 구조로의 전환은 모든 통신 사업자에게 인프라 경제성을 혁신적으로 변화시킬 것입니다. Digital Nasional Berhad는 2024년 12월까지 인구의 80.2%를 커버하게 될 것이며, U Mobile이 전국 규모의 두 번째 네트워크를 구축하겠다는 사명은 중복성을 제공하여 도매 요금 인하와 서비스 품질 향상으로 이어질 것입니다. U Mobile은 차이나 모바일 인터내셔널(China Mobile International)과의 제휴를 통해 18개월 이내에 5,000-7,000곳의 5G 기지국을 설치하겠다고 공언하고 있습니다. 이는 독점으로 인한 병목 현상이 발생할 것이라는 기존의 우려를 완화하면서도 5G 보급을 가속화하는 적극적인 일정입니다. 이러한 두 가지 전략적 전개에 따라 민간용 5G 슬라이스 주파수 대역도 개방되어, 산업 단지에서는 머신 비전을 활용한 검사나 자율형 자재 운반 등 지연에 민감한 용도의 도입이 가능해집니다. 단일 공급업체에 의한 제약이 해소됨에 따라, 말레이시아의 통신 MNO들은 가격 경쟁에만 의존하는 대신, 차별화된 5G 요금제나 서비스 수준 계약(SLA)을 통해 혁신을 도모할 여지를 얻게 될 것입니다.
1인당 모바일 데이터 소비량 증가와 ARPU 상승
4K 동영상 스트리밍, 클라우드 게임, AI를 활용한 모바일 앱에 힘입어 월간 데이터 사용량은 2024년 21.6GB에서 2029년까지 51.9GB로 급증할 것으로 예측됩니다. 이러한 급증에 대응하기 위해 통신사들은 속도 제한이 있는 ‘무제한’ 요금제를 단계적으로 폐지하고, 속도 제한이 없는 5G 패키지로 전환하고 있습니다. Astro가 Netflix 및 Disney+Hotstar와 맺은 번들 상품으로 대표되는 OTT 제휴는 고객 유지율을 높이고 해지율을 억제하는 매력적인 컨텐츠 생태계를 제공합니다. 하지만 통신 사업자들은 미묘한 균형을 모색하고 있습니다. 현재 모든 통신 사업자에서 일반화된 50링깃 미만의 ‘무제한 데이터’ 요금제는 속도에 따른 차별화가 적절히 이루어지지 않을 경우 ARPU의 잠재적 증가를 저해할 우려가 있습니다. 성공의 열쇠는 가입자를 프리미엄 속도 요금제로 전환시키는 동시에, 엣지 호스팅형 게임이나 UHD 스포츠 중계와 같은 독점적인 서비스 기능을 더 고가 요금제로만 제한하는 데 있습니다.
치열한 무제한 데이터 요금 경쟁이 이익률을 압박
50링깃 미만의 무제한 요금제는 5G에 대한 설비 투자가 정점에 달한 바로 그 시점에, 수익성을 압박하는 최저 수준을 확립해 버렸습니다. U Mobile의 주말 한정 5G 지원 선불 요금제(25링깃)와 CelcomDigi의 동 가격대 3 Mbps 요금제로 인해, 모든 통신 사업자는 유사한 프로모션을 따라 할 수밖에 없게 되었습니다. 그 결과 발생한 이익률 압박은 심각합니다. 기본 요금에 데이터 무제한이 포함될 경우, 통신 속도에 따른 프리미엄 요금은 의미를 잃게 되기 때문입니다. 공정 사용 정책에 따른 통신 속도 제한은 약 200GB 사용 후 네트워크 혼잡을 완화하는 데 도움이 되지만, 고객들은 속도 저하를 ‘약속 위반’으로 인식하는 경향이 강해지고 있어, 고객 이탈이나 소셜 미디어상의 비판을 초래할 위험이 있습니다. 수익성을 회복하기 위해 통신 사업자들은 현재 수요 탄력성이 낮고 지불 의향이 높은 기업용 계약, 컨텐츠 번들, 핀테크 관련 사업으로 무게중심을 옮기고 있습니다.
부문 분석
2025년, 데이터 및 인터넷 서비스는 말레이시아 통신 MNO 시장 점유율의 53.62%를 차지하며, 2031년까지 연평균 성장률(CAGR) 2.99%로 성장을 이어가고 있습니다. UHD 스트리밍, Gen-AI 탑재 스마트폰, 클라우드 게임으로 인한 트래픽 증가로 인해 통신 사업자들은 백홀 확충 및 캐리어급 엣지 노드 도입을 서둘러야 하는 상황에 처해 있습니다. 음성 서비스는 로밍 수요 회복과 기업용 통합 커뮤니케이션 번들에 힘입어 말레이시아 통신 MNO 시장 규모의 19.18%를 계속 차지하고 있지만, 연평균 성장률(CAGR)은 2.70%에 그쳐 데이터 주도 분야에는 미치지 못하는 상황입니다. 메시징, 부가가치 서비스, 도매 트랜짓은 합계로 매출의 16.04%를 차지하며, 하이퍼스케일 데이터센터 사업자들의 대역폭 수요 증가에 힘입어 2.98%의 성장률을 기록하고 있습니다.
IoT 및 M2M은 총 수익의 5.05%에 불과하지만, JENDELA 회랑 내의 인더스트리 4.0 로드맵과 스마트 시티 시범 사업의 뒷받침을 받아 3.11%라는 가장 높은 연평균 성장률(CAGR)을 기록하고 있습니다. 말레이시아 통신 MNO 시장에서 IoT 모듈 시장 규모는 제조 현장의 관리자들이 고밀도 센서 그리드를 활용한 예측 유지보수 시스템으로 전환함에 따라 확대될 것으로 예측됩니다. OTT 및 유료 TV 서비스는 매출의 6.11%를 차지하며 3.05%의 성장 궤도를 타고 있습니다. Astro가 Netflix 및 Disney+Hotstar와 체결한 직접 과금 파트너십은 통신 사업자가 컨텐츠 집적을 통해 ARPU 증가를 확보하는 방법을 보여줍니다.
기타 혜택:
- 엑셀 형식 시장 예측(ME) 시트
- 3개월간의 애널리스트 지원
자주 묻는 질문
목차
제1장 서론
제2장 조사 방법
제3장 주요 요약
제4장 시장 구도
제5장 시장 규모와 성장 예측
제6장 경쟁 구도
제7장 시장 기회와 향후 전망
JHS 26.09.11According to Mordor Intelligence, the Malaysia telecom MNO market size was valued at USD 7.02 billion in 2025 and estimated to grow from USD 7.23 billion in 2026 to reach USD 8.36 billion by 2031, at a CAGR of 2.96% during the forecast period (2026-2031).
This report is Segmented by Service Type (Voice Services, Data and Internet Services, Messaging Services, Iot and M2M Services, OTT and PayTV Services, and More), and End User (Enterprises, and Consumers). The Market Forecasts are Provided in Terms of Value (USD) and Volume (Subscribers).
Malaysia Telecom MNO Market Trends and Insights
5G Coverage Expansion Under JENDELA & Dual-Network Model
The leap from a single wholesale network to a competitive dual-network structure rewrites infrastructure economics for every carrier. Digital Nasional Berhad achieved 80.2% population coverage by December 2024, and U Mobile's mandate to erect a second nationwide grid introduces redundancy that should narrow wholesale fees and improve quality of service. U Mobile pledges 5,000-7,000 5G sites within 18 months in partnership with China Mobile International, an aggressive schedule that accelerates adoption while mitigating the prior fear of a bottlenecked monopoly. The dual-track rollout also unlocks spectrum for private 5G slices, positioning industrial zones for latency-sensitive applications such as machine-vision inspection and autonomous material handling. By removing single-supplier constraints, Malaysia telecom MNO market participants gain room to innovate on differentiated 5G tariffs and service-level agreements rather than competing solely on price.
Rising Per-Capita Mobile Data Consumption & ARPU Uplift
Monthly data usage is projected to jump from 21.6 GB in 2024 to 51.9 GB by 2029, propelled by 4K video streaming, cloud gaming, and AI-enhanced mobile apps. To capture this surge, carriers are phasing out throttled "unlimited" offers in favor of tiered 5G packages that monetize uncapped speeds. OTT alliances, typified by Astro's bundle with Netflix and Disney+Hotstar, deliver sticky content ecosystems that lengthen tenure and combat churn. Operators nevertheless navigate a delicate balance; unlimited data plans below RM 50, now common across all networks, threaten to dilute potential ARPU gains if speed-based differentiation is poorly executed. Success hinges on migrating subscribers to premium speed tiers while reserving exclusive service features-such as edge-hosted gaming or UHD sports streams-for higher-priced plans.
Aggressive Unlimited-Data Price Wars Compressing Margins
Unlimited plans under RM 50 have set a low watermark that squeezes profitability just as 5G capex peaks. U Mobile's prepaid offer with 5G-enabled weekends at RM 25 and CelcomDigi's 3 Mbps plan at the same price have forced every carrier to replicate similar promotions. The resulting margin squeeze is stark: speed-based premiums vanish when baseline tariffs include uncapped data. Fair-usage throttling helps to limit network congestion after roughly 200 GB of use, yet customers increasingly view speed reductions as broken promises, risking churn and social-media backlash. To restore economics, operators now pivot toward enterprise contracts, content bundling and fintech adjacencies where elasticity is lower and willingness to pay is higher.
Other drivers and restraints analyzed in the detailed report include:
- Government-Backed Fiber Rollout Programs (NFCP, JENDELA)
- Manufacturing Clusters' Demand for Private 5G & IoT Solutions
- High Spectrum Fees & USO Levies Straining Cash Flow
For complete list of drivers and restraints, kindly check the Table Of Contents.
Segment Analysis
Data and internet services captured 53.62% of Malaysia telecom MNO market share in 2025, running ahead at a 2.99% CAGR through 2031. Growing traffic from UHD streaming, Gen-AI smartphones, and cloud gaming drives operators to upscale backhaul and deploy carrier-grade edge nodes. Voice remains a 19.18% slice of Malaysia telecom MNO market size, cushioned by roaming recovery and unified-communications bundles sold into enterprise accounts, yet its 2.70% CAGR lags data-led verticals. Messaging, value-added services, and wholesale transit combine for 16.04% of revenue and post a 2.98% growth clip, buoyed by rising demand for bandwidth from hyperscale datacenter operators.
IoT & M2M stands at only 5.05% of total receipts but records the highest 3.11% CAGR, propelled by Industry 4.0 roadmaps and smart-city pilots within JENDELA corridors. The Malaysia telecom MNO market size for IoT modules is forecast to expand as manufacturing supervisors switch to predictive maintenance systems that rely on high-density sensor grids. OTT and Pay-TV services contribute 6.11% of revenue on a 3.05% trajectory; Astro's direct billing partnerships with Netflix and Disney+Hotstar illustrate how carriers secure incremental ARPU via content aggregation.
Complete Report Scope:
- Overall Telecom Revenue and ARPU
- Service Type
- Voice Services
- Data and Internet Services
- Messaging Services
- IoT and M2M Services
- OTT and PayTV Services
- Other Services (VAS, Roaming & International Services, Enterprise & Wholesale Services, etc.)
- End-user
- Enterprises
- Consumer
List of Companies Covered in this Report:
- CelcomDigi
- Maxis
- U Mobile
- Yes (YTL Communications)
- Unifi Mobile (Telekom Malaysia)
Additional Benefits:
- The market estimate (ME) sheet in Excel format
- 3 months of analyst support
TABLE OF CONTENTS
1 INTRODUCTION
- 1.1 Study Assumptions and Market Definition
- 1.2 Scope of the Study
2 RESEARCH METHODOLOGY
3 EXECUTIVE SUMMARY
4 MARKET LANDSCAPE
- 4.1 Market Overview
- 4.2 Regulatory and Policy Framework
- 4.3 Spectrum Landscape & Competitive Holdings
- 4.4 Telecom Industry Ecosystem
- 4.5 Macroeconomic & External Drivers
- 4.6 Porter's Five Forces Analysis
- 4.6.1 Competitive Rivalry
- 4.6.2 Threat of New Entrants
- 4.6.3 Bargaining Power of Suppliers
- 4.6.4 Bargaining Power of Buyers
- 4.6.5 Threat of Substitutes
- 4.7 Key MNO KPIs (2020-2025)
- 4.7.1 Unique Mobile Subscribers & Penetration Rate
- 4.7.2 Mobile Internet Users & Penetration Rate
- 4.7.3 SIM Connections by Access Technology & Penetration
- 4.7.4 Cellular IoT / M2M Connections
- 4.7.5 Broadband Connections (Mobile & Fixed)
- 4.7.6 ARPU (Average Revenue Per User)
- 4.7.7 Average Data Usage per Subscription (GB/month)
- 4.8 Market Drivers
- 4.8.1 5G coverage expansion under JENDELA & dual-network model
- 4.8.2 Rising per-capita mobile data consumption & ARPU uplift
- 4.8.3 Government-backed fibre rollout programmes (NFCP, JENDELA)
- 4.8.4 Manufacturing clusters' demand for private 5G & IoT solutions
- 4.8.5 Telco-OTT content bundling boosting Pay-TV & data upsell
- 4.8.6 e-SIM tourist & migrant plans adding incremental prepaid revenue
- 4.9 Market Restraints
- 4.9.1 Aggressive unlimited-data price wars compressing margins
- 4.9.2 High spectrum fees & USO levies straining cash flow
- 4.9.3 Fibre backhaul bottlenecks outside Klang Valley
- 4.9.4 Policy uncertainty over DNB stake divestment
- 4.10 Technological Outlook
- 4.11 Analysis of key business models in Telecom Sector
- 4.12 Analysis of Pricing Models and Pricing
5 MARKET SIZE & GROWTH FORECASTS (VALUE)
- 5.1 Overall Telecom Revenue and ARPU
- 5.2 Service Type
- 5.2.1 Voice Services
- 5.2.2 Data and Internet Services
- 5.2.3 Messaging Services
- 5.2.4 IoT and M2M Services
- 5.2.5 OTT and PayTV Services
- 5.2.6 Other Services (VAS, Roaming & International Services, Enterprise & Wholesale Services, etc.)
- 5.3 End-user
- 5.3.1 Enterprises
- 5.3.2 Consumer
6 COMPETITIVE LANDSCAPE
- 6.1 Market Concentration
- 6.2 Strategic Moves and Investments by key vendors, 2023-2025
- 6.3 Market share analysis for MNOs, 2024
- 6.4 Product Benchmarking Analysis for mobile network services
- 6.5 MNO snapshot (subscribers, churn rate, ARPU, etc.)
- 6.6 Company Profiles* of MNOs (Includes Business Overview | Service Portfolio | Financials | Business Strategy and Recent Developments | SWOT Analysis)
- 6.6.1 CelcomDigi
- 6.6.2 Maxis
- 6.6.3 U Mobile
- 6.6.4 Yes (YTL Communications)
- 6.6.5 Unifi Mobile (Telekom Malaysia)
7 MARKET OPPORTUNITIES & FUTURE OUTLOOK
- 7.1 White-space & Unmet-Need Assessment