
|
시장보고서
상품코드
2125555
전기차 시장 : 점유율 분석, 업계 동향과 통계, 성장 예측(2026-2031년)Electric Vehicles - Market Share Analysis, Industry Trends & Statistics, Growth Forecasts (2026 - 2031) |
||||||
 Mordor Intelligence
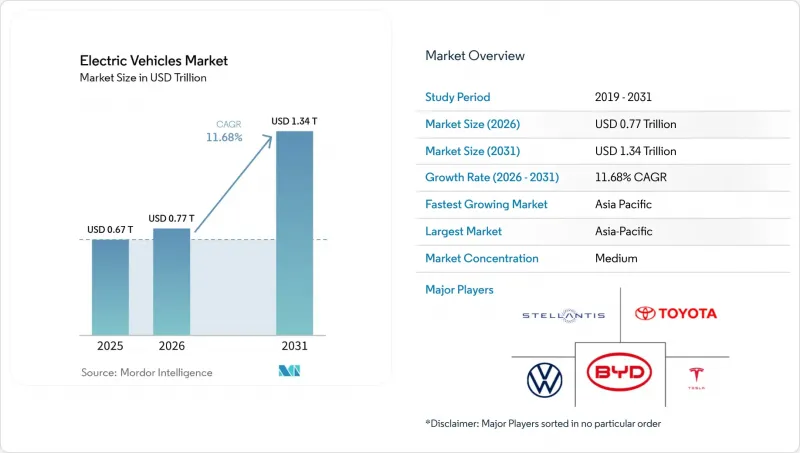
Mordor Intelligence에 의하면, 전기차 시장 규모는 2025년에 6,700억 달러로 평가되었고 2026년에는 7,700억 달러로 확대되어 2026년부터 2031년까지 CAGR 11.68%로 성장을 지속하여, 2031년까지 1조 3,400억 달러에 이를 것으로 예측됩니다.
본 보고서는 파워트레인(BEV, PHEV, FCEV), 차종(승용차, 상용차), 배터리 화학 조성(LFP, NMC 등), 모터 아키텍처(PMSM, 유도 모터 등), 주행 거리(단거리, 중거리, 장거리, 초장거리),전압(저전압, 중전압, 고전압, 초고전압), 지역별로 분류되어 있습니다. 시장 예측은 금액(달러) 및 수량(대수)으로 제시되어 있습니다.
전 세계 전기차 시장 동향 및 인사이트
배터리 팩 비용 하락이 80달러/kWh의 임계치에 근접
리튬 이온 배터리 팩의 가격은 대폭 하락했으며, 향후 몇 년 동안 더욱 하락할 것으로 예측됩니다. 이러한 가격 하락은 모듈 하우징을 제거한 ‘셀-투-팩(cell-to-pack)’ 설계의 도입과 중국의 LFP 생산량 확대에 기인합니다. 주요 제조업체들은 이미 장기 계약을 통해 저비용으로 배터리 팩을 공급하고 있습니다. 이러한 가격 전략 덕분에 자동차 제조업체들은 보조금에 의존하지 않고도 더 저렴한 가격의 모델을 제공할 수 있게 되었습니다. 비용이 내연기관 파워트레인과의 가격 격차를 좁혀감에 따라, 동남아시아나 라틴아메리카 등 가격에 민감한 지역에서의 도입이 가속화되고 있습니다. 또한, 주요 기업들의 전고체 배터리 시범 생산 라인은 2020년대 말까지 추가적인 비용 절감을 목표로 하고 있어, 주행 거리가 연장된 프리미엄 모델의 출시를 뒷받침하고 있습니다. 이러한 비용 추세가 지속되는 가운데, 전기차는 기존 파워트레인에 비해 계속해서 상당한 가격 우위를 유지할 전망입니다.
주요 시장의 차량 함대 평균 CO₂ 배출 기준 강화
중국은 듀얼 크레딧 할당량을 확대했고, EU는 배출량 상한선을 강화했습니다. 한편, 캘리포니아주의 ‘Advanced Clean Cars II’도 곧 시행될 예정입니다. 이러한 조치들로 인해 제로 에미션 달성을 위한 막대한 투자가 촉진되고 있습니다. 유럽에서는 기준 미준수에 대한 벌칙이 대폭 상향 조정되어, 폭스바겐, 스텔란티스, 제너럴 모터스 등 주요 자동차 기업들의 연구개발(R&D) 우선순위를 바꿀 정도의 중대한 위협이 되고 있습니다. 그 결과, 이러한 유서 깊은 자동차 제조업체들은 스케이트보드형 플랫폼 개발을 가속화하고, 새로운 내연기관 프로젝트 계획을 보류하고 있습니다. 규제 압력은 전기차 시장의 방향성을 결정짓는 중요한 요인이 되고 있습니다.
중요 광물 공급망의 집중 위험
세계 니켈 및 코발트 매장량의 대부분을 보유한 인도네시아와 콩고 민주 공화국은 전기차 시장에 영향을 미치는 정책 전환으로 인한 가격 변동의 중심에 계속 놓여 있습니다. 인도네시아가 수출 규제를 도입한 후 니켈 가격은 급등했으나, 이후 급락했습니다. 각 자동차 제조업체들은 ‘인플레이션 억제법’의 요건을 준수하기 위해 자유무역협정 대상국으로부터의 자재 조달을 확대되고 있습니다. 예를 들어, 제너럴 모터스는 리튬 아메리카스의 ‘사커 패스’ 프로젝트에 막대한 투자를 하고 있습니다. 그러나 이러한 다각화 노력에도 불구하고, 전 세계 리튬 및 코발트 정제 시장에서 중국은 여전히 큰 점유율을 차지하고 있습니다. 이러한 지배적 지위는 공급망의 취약성을 높이고, 기대되는 이익률 확대를 제한하는 요인으로 작용하고 있습니다.
부문별 분석
2025년 현재, 배터리식 전기차(BEV)는 전기차 시장 점유율의 72.12%를 차지하고 있으며, 2031년까지 연평균 성장률(CAGR) 13.43%를 나타낼 것으로 전망됩니다. 순수 전기차(BEV)는 LFP(인산철리튬) 배터리의 비용 절감과 장거리 주행의 이점을 활용하는 반면, 플러그인 하이브리드차(PHEV)는 듀얼 파워트레인의 복잡성으로 인해 기피되는 경향이 커지면서 성장이 정체되고 있습니다. 연료전지차는 수소 충전소 부족으로 여전히 제약을 받고 있으며, 2024년 세계 판매 대수는 1만 5,000대 미만에 그쳤습니다. 중국과 캘리포니아주의 단계적 폐지 일정에 따라 2030년 이후 하이브리드차에 대한 규제 크레딧이 축소됨에 따라 BEV의 우위가 확고해질 것입니다.
플러그인 하이브리드 차량은 충전소가 드문 지방 지역에서는 여전히 수요가 있지만, 실리콘 음극을 채택한 BEV의 주행 거리가 600km에 달함에 따라 가격 차이는 줄어들고 있습니다. 법인 고객은 차량 1대당 2가지 유형의 파워트레인을 유지하려는 의지가 제한적이어서, 이것이 판매 대수 증가를 억제하고 있습니다. 청정 수소 비용이 하락하면 연료전지차는 장거리 운송의 틈새 시장을 개척할 가능성이 있지만, 그러한 시나리오는 본 예측 기간을 벗어난 이야기입니다. 전반적으로 전기차 시장은 더 대규모의 전용 배터리 플랫폼으로의 전환을 지속할 전망입니다.
2025년 매출에서 승용차가 차지하는 비중은 79.28%였으나, 전기차 시장에서 상용차는 2031년까지 12.83%라는 가장 높은 연평균 성장률(CAGR)을 기록했습니다. 택배 업체나 지자체 버스 차량은 다년 계약을 체결하고 있기 때문에 생산은 소비자 수요 주기의 영향을 덜 받습니다. 포드 ‘E-Transit’이나 메르세데스-벤츠 ‘eSprinter’와 같은 소형 상용 밴은 디젤 차량에 비해 킬로미터당 운영 비용을 40-50% 절감하고 있어, 기업의 차량 전기화를 가속화하고 있습니다.
중형·대형 트럭은 배터리 비용의 하락과 전기차 시장 전반에 걸친 도시 지역 무공해 구역의 확대에 힘입어 경제적 장벽을 극복해 나가고 있습니다. BYD의 12미터 전기 버스는 이미 중국 내 신형 도시 버스 판매의 대부분을 차지하고 있습니다. 승용 SUV는 화물 적재의 유연성을 추구하는 소비자의 선호에 힘입어 판매 대수에서 1위 자리를 유지하고 있지만, 세단이나 해치백의 경우 각 OEM 업체들이 크로스오버 차량이나 상용 섀시에 자본을 집중하고 있어 모델 라인업이 축소되는 추세입니다.
지역별 분석
아시아태평양은 2025년 판매 대수의 52.73%를 차지하며, 중국의 LFP 블레이드형 배터리와 인도의 ‘생산 연계 인센티브(PLI)’ 프로그램을 통해 국내 생산 능력이 확대됨에 따라,연평균 성장률(CAGR) 13.81%로 성장하며, 전기차 시장에서 주도적 지위를 더욱 공고히할 것으로 전망됩니다. 중국은 막대한 판매 대수로 시장을 주도한 반면, 한국의 현대자동차와 기아는 상당한 수의 차량을 수출했습니다. 시장 침투율이 비교적 낮은 일본에서는 수요를 촉진하기 위해 보조금을 확대되고 있습니다. 한편, 태국과 인도네시아는 동남아시아의 주요 조립 거점으로 부상하고 있으며, 세제 혜택과 원자재의 원활한 조달을 무기로 각 OEM 기업을 유치하여 전기차 분야에서의 우위를 공고히 하고 있습니다.
북미는 시장에서 뚜렷한 점유율을 차지하고 있습니다. 정책 조치에 따라 현지 조립 및 부품 조달이 한층 더 촉진될 전망입니다. 테슬라는 미국의 BEV(배터리식 전기차) 시장에서 큰 점유율을 차지하고 있지만, GM, 포드, 스텔란티스도 향후 몇 년 동안 생산 대수를 더욱 늘릴 궤도에 올라 있습니다. 캐나다의 ZEV(무공해차) 규제는 캘리포니아주의 일정과 연동되어 있으며, 멕시코에 건설 예정인 기가팩토리는 해당 지역의 무역적 우위를 활용하고 있습니다. 지방 지역의 충전 인프라 부족과 배전망 문제가 장벽으로 작용하고 있는 반면, 연방 정부 및 주 정부의 막대한 인센티브가 인프라 확충을 가속화하는 데 기여하고 있습니다.
유럽에서는 노르웨이의 신차에 대한 높은 보급률과 독일의 현저한 진전을 선도적인 동력으로 삼아 상당한 시장 점유율을 확보했습니다. 더욱 엄격해진 CO2 배출 목표와 ‘Fit for 55’ 이니셔티브가 자동차 제조업체들의 전략을 형성하고 있습니다. 폭스바겐, 스텔란티스, 르노는 가까운 미래에 이 3개사가 합쳐서 상당한 수의 전기차를 연간 생산하는 것을 목표로 하고 있습니다. 영국은 향후 10년 이내에 무공해 차량의 판매 비율을 높이는 것을 추진하고 있으며, 동유럽에서는 EU 자금을 활용하여 회랑형 충전기 설치가 빠르게 진행되고 있습니다. 중동 및 아프리카에서는 아직 초기 단계이긴 하지만, 사우디아라비아의 루시드에 대한 투자나 두바이의 택시 전기화 움직임은 전기차 시장이 급속히 확대되고 있음을 시사하고 있습니다.
기타 혜택:
- 엑셀 형식 시장 예측(ME) 시트
- 3개월간의 애널리스트 지원
자주 묻는 질문
목차
제1장 서론
제2장 조사 방법
제3장 주요 요약
제4장 주요 업계 동향
제5장 시장 구도
제6장 시장 규모와 성장 예측
제7장 경쟁 구도
제8장 시장 기회와 향후 전망
제9장 CEO을 위한 중요 전략적 과제
JHS 26.09.11According to Mordor Intelligence, the electric vehicle market size was valued at USD 0.67 trillion in 2025, is expected to grow to USD 0.77 trillion in 2026, and is forecast to reach USD 1.34 trillion by 2031, at an 11.68% CAGR over 2026-2031.
This report is Segmented by Powertrain (BEV, PHEV, and FCEV), Vehicle Type (Passenger Car, and Commercial Vehicle), Battery Chemistry (LFP, NMC, and More), Motor Architecture (PMSM, Induction, and Others), Range (Short, Mid, Long, and Ultra-Long), Voltage (Low, Mid, High, and Ultra-High), and Geography. The Market Forecasts in Value (USD) and Volume (Units).
Global Electric Vehicles Market Trends and Insights
Battery-Pack Cost Deflation Approaching USD 80 /kWh Threshold
Lithium-ion pack prices have declined significantly and are expected to drop further in the coming years. This reduction is attributed to the adoption of cell-to-pack designs, which eliminate module housings, and the scaling up of Chinese LFP output . Leading manufacturers are already supplying packs at lower costs through long-term contracts. This pricing strategy allows automakers to offer more affordable models without relying on subsidies. With costs approaching parity with internal-combustion powertrains, adoption is accelerating in price-sensitive regions such as Southeast Asia and Latin America. Additionally, solid-state pilot lines from key players are targeting even lower costs by the end of the decade, supporting premium offerings with extended range. As these cost trends continue, electric vehicles are set to maintain a substantial price advantage over traditional drivetrains.
Tightening Fleet-Average CO2 Standards Across Major Markets
China increased its dual-credit quota, while the EU tightened its emissions limit. Meanwhile, California's Advanced Clean Cars II is set to take effect soon. These measures are driving significant investments into zero-emission initiatives. In Europe, non-compliance penalties have risen significantly, creating a substantial threat that is shifting R&D priorities for automotive giants like Volkswagen, Stellantis, and General Motors. As a result, these legacy OEMs are accelerating the development of skateboard platforms and shelving plans for new internal-combustion projects. Regulatory pressures have become a key factor shaping the direction of the electric vehicle market.
Critical-Minerals Supply-Chain Concentration Risk
Indonesia and the Democratic Republic of the Congo, which hold most of the world's nickel and cobalt reserves, remain at the center of price volatility driven by policy shifts influencing the electric vehicle market. Nickel prices surged significantly after Indonesia imposed export restrictions before declining sharply. As OEMs work to comply with the Inflation Reduction Act's requirements, they are increasingly sourcing materials from countries covered by free trade agreements. General Motors, for instance, has made a significant investment in Lithium Americas' Thacker Pass project. However, despite these diversification efforts, China continues to dominate the refining of a substantial share of the world's lithium and cobalt. This dominance increases supply chain vulnerability and limits the expected margin expansion.
Other drivers and restraints analyzed in the detailed report include:
- Ultra-Rapid Charging Infrastructure Along Freight Corridors
- Silicon-Anode Penetration Enabling Ultra-Long-Range Segments
- Grid-Upgrade Bottlenecks at Distribution Level
For complete list of drivers and restraints, kindly check the Table Of Contents.
Segment Analysis
Battery electric vehicles held 72.12% electric vehicle market share in 2025 and are tracking a 13.43% CAGR through 2031. Pure-electric architectures capitalize on falling LFP costs and corridor charging, while plug-in hybrids plateau as dual-powertrain complexity loses favor. Fuel-cell formats remain constrained by a scarcity of hydrogen stations, delivering fewer than 15,000 global units in 2024. Phase-out timelines in China and California reduce regulatory credits for hybrids beyond 2030, thereby cementing the primacy of BEVs.
Plug-in hybrids still serve rural areas with sparse charging stations, but the price delta erodes as silicon-anode BEVs reach a 600 km range. Fleet buyers show a limited appetite for maintaining two drivetrains per vehicle, which curbs volume growth. Fuel cell units may find long-haul niches once green hydrogen costs fall, yet that scenario sits outside the forecast window. Net effect: The electric vehicle market continues its shift toward dedicated battery platforms on a larger scale.
Passenger cars accounted for 79.28% of 2025 revenue, while commercial vehicles posted the fastest 12.83% CAGR to 2031 in the electric vehicle market. Parcel operators and municipal bus fleets lock in multi-year contracts, insulating production from consumer cycles. Light commercial vans, such as the Ford E-Transit and Mercedes-Benz eSprinter, achieve 40-50% lower running costs per kilometer compared to their diesel rivals, accelerating corporate fleet conversions.
Medium- and heavy-duty trucks are crossing the economic threshold as battery costs decline and urban zero-emission zones expand across the electric vehicle market. BYD's 12-meter electric bus already anchors the majority of new urban bus sales in China. Passenger SUVs maintain volume leadership due to consumer preference for cargo versatility; however, sedans and hatchbacks see shrinking model lineups as OEMs redirect capital to crossovers and commercial chassis.
Complete Report Scope:
- By Powertrain
- Battery Electric Vehicles (BEVs)
- Plug-in Hybrid Electric Vehicles (PHEVs)
- Fuel Cell Electric Vehicles (FCEVs)
- By Vehicle Type
- Passenger Car
- Hatchback
- Sedan
- Sports Utility Vehicle/Crossover
- Multi-purpose Vehicle
- Commercial Vehicle
- Light Commercial Vehicle
- Medium and Heavy-duty Truck
- Bus
- Passenger Car
- By Battery Chemistry
- Lithium Iron Phosphate (LFP)
- Lithium Nickel Manganese Cobalt Oxide (NMC)
- Lithium Nickel Cobalt Aluminum Oxide (NCA)
- Others
- By Motor Architecture
- Permanent-Magnet Synchronous Motors (PMSM/IPM)
- Induction Motors (IM)
- Others (SRM, Axial Flux, etc.)
- By Range
- Short (0-200 km)
- Mid (200-400 km)
- Long (400-600 km)
- Ultra-Long (Above 600 km)
- By Voltage
- Low Voltage (Below 200 V)
- Mid Voltage (200-400 V)
- High Voltage (400-800 V)
- Ultra-High Voltage (Above 800 V)
- By Geography
- North America
- United States
- Canada
- Rest of North America
- South America
- Brazil
- Argentina
- Rest of South America
- Europe
- Germany
- United Kingdom
- France
- Italy
- Spain
- Rest of Europe
- Asia-Pacific
- China
- India
- Japan
- South Korea
- Rest of Asia-Pacific
- Middle-East and Africa
- United Arab Emirates
- Saudi Arabia
- South Africa
- Turkey
- Rest of Middle-East and Africa
- North America
Geography Analysis
The Asia-Pacific region commanded 52.73% of the 2025 volume and is projected to track a 13.81% CAGR reinforcing its leadership in the electric vehicle market, as China's LFP blade battery and India's Production Linked Incentive program add domestic capacity. China led the charge with a significant number of EVs sold, while South Korea's Hyundai and Kia exported a substantial volume of units. Japan, with relatively low market penetration, is increasing subsidies to boost demand. Meanwhile, Thailand and Indonesia are emerging as key assembly hubs in Southeast Asia, luring OEMs with tax breaks and easy access to raw materials, solidifying their dominance in the electric vehicle arena.
North America accounted for a notable share of the market. Policy measures are poised to boost local assembly and component sourcing. Tesla commands a significant portion of the United States BEV market, but GM, Ford, and Stellantis are on track to achieve higher production rates in the coming years. Canada's ZEV mandate is in sync with California's schedule, and Mexico's upcoming Gigafactory is capitalizing on regional trade advantages. While rural charging gaps and distribution grid challenges pose hurdles, substantial federal and state incentives are helping to accelerate infrastructure development.
Europe secured a considerable market share, spearheaded by Norway's high new-car penetration and Germany's notable progress. Stricter CO2 targets and the "fit-for-55" initiative are shaping OEM strategies. Volkswagen, Stellantis, and Renault are eyeing a combined annual output of a significant number of EVs in the near future. The United Kingdom is pushing for a high percentage of zero-emission sales within the decade, and Eastern Europe is rapidly installing corridor chargers with EU funds. In the Middle East and Africa, while still in nascent stages, Saudi Arabia's investment in Lucid and Dubai's move to electrify taxis hint at a burgeoning electric vehicle landscape.
- BYD Company Ltd.
- Tesla Inc.
- SAIC Motor
- Volkswagen AG
- Hyundai Motor Company
- Nissan Motor Co. Ltd.
- Stellantis N.V.
- Daimler AG (Mercedes-Benz)
- General Motors
- Ford Motor Company
- Toyota Motor Corporation
- BMW AG
- Honda Motor Co. Ltd.
- Volvo Car AB
- Rivian Automotive LLC
- Lucid Group Inc.
- NIO Inc.
- Tata Motors Ltd.
Additional Benefits:
- The market estimate (ME) sheet in Excel format
- 3 months of analyst support
TABLE OF CONTENTS
1 Introduction
- 1.1 Study Assumptions and Market Definition
- 1.2 Scope of the Study
2 Research Methodology
3 Executive Summary
4 Key Industry Trends
- 4.1 Urbanization, Population and Vehicle/Transit Demand
- 4.2 Car Ownership and Motorization Rate
- 4.3 EV Penetration in Car Market
- 4.4 Fuel vs Electricity Price Spread (Per km, ICE vs EV)
- 4.5 EV vs ICE Total Cost of Ownership (TCO) Gap
- 4.6 Financing and Ownership Models (Loans, Leasing, Subscription)
- 4.7 Battery Chemistry Mix and Pack Energy Density (LFP vs NMC etc.)
- 4.8 Home, Workplace and Public Charger Access / Density
- 4.9 Fast-Charging Network Coverage and Power Bands
- 4.10 Alternative Fuels Infrastructure (Hydrogen for FCEVs)
- 4.11 Subsidy and Consumer Incentive Value
- 4.12 OEM EV Line-up and Model Pipeline
- 4.13 Value-Chain and Distribution-Channel Analysis
- 4.14 Regulatory, Fiscal and Industrial Policy Framework
5 Market Landscape
- 5.1 Market Overview
- 5.2 Market Drivers
- 5.2.1 Battery-Pack Cost Per kWh Keeps Falling Below USD 80 By 2027
- 5.2.2 Ultra-Rapid (Above 350 kW) Charger Roll-Outs Along Freight Corridors
- 5.2.3 Tightening Fleet-Average CO2 Standards in China, Europe, and the United States
- 5.2.4 Corporate-Fleet Decarbonization Procurement Mandates
- 5.2.5 Silicon-Anode Penetration Boosting Above 600 Km Segment
- 5.2.6 Secondary-Use Battery Value-Chain Lowering TCO
- 5.3 Market Restraints
- 5.3.1 Grid-Upgrade Bottlenecks at the Distribution Level
- 5.3.2 Critical-Minerals (Li, Ni) Supply-Chain Concentration Risk
- 5.3.3 Warranty-Period Residual-Value Uncertainty in Emerging Markets
- 5.3.4 Cyber-Security and OTA-Update Compliance Costs
- 5.4 Value / Supply-Chain Analysis
- 5.5 Regulatory Landscape
- 5.6 Technological Outlook
- 5.7 Porter's Five Forces
- 5.7.1 Threat of New Entrants
- 5.7.2 Bargaining Power of Suppliers
- 5.7.3 Bargaining Power of Buyers
- 5.7.4 Threat of Substitutes
- 5.7.5 Competitive Rivalry
6 Market Size and Growth Forecasts (Value and Volume)
- 6.1 By Powertrain
- 6.1.1 Battery Electric Vehicles (BEVs)
- 6.1.2 Plug-in Hybrid Electric Vehicles (PHEVs)
- 6.1.3 Fuel Cell Electric Vehicles (FCEVs)
- 6.2 By Vehicle Type
- 6.2.1 Passenger Car
- 6.2.1.1 Hatchback
- 6.2.1.2 Sedan
- 6.2.1.3 Sports Utility Vehicle/Crossover
- 6.2.1.4 Multi-purpose Vehicle
- 6.2.2 Commercial Vehicle
- 6.2.2.1 Light Commercial Vehicle
- 6.2.2.2 Medium and Heavy-duty Truck
- 6.2.2.3 Bus
- 6.2.1 Passenger Car
- 6.3 By Battery Chemistry
- 6.3.1 Lithium Iron Phosphate (LFP)
- 6.3.2 Lithium Nickel Manganese Cobalt Oxide (NMC)
- 6.3.3 Lithium Nickel Cobalt Aluminum Oxide (NCA)
- 6.3.4 Others
- 6.4 By Motor Architecture
- 6.4.1 Permanent-Magnet Synchronous Motors (PMSM/IPM)
- 6.4.2 Induction Motors (IM)
- 6.4.3 Others (SRM, Axial Flux, etc.)
- 6.5 By Range
- 6.5.1 Short (0-200 km)
- 6.5.2 Mid (200-400 km)
- 6.5.3 Long (400-600 km)
- 6.5.4 Ultra-Long (Above 600 km)
- 6.6 By Voltage
- 6.6.1 Low Voltage (Below 200 V)
- 6.6.2 Mid Voltage (200-400 V)
- 6.6.3 High Voltage (400-800 V)
- 6.6.4 Ultra-High Voltage (Above 800 V)
- 6.7 By Geography
- 6.7.1 North America
- 6.7.1.1 United States
- 6.7.1.2 Canada
- 6.7.1.3 Rest of North America
- 6.7.2 South America
- 6.7.2.1 Brazil
- 6.7.2.2 Argentina
- 6.7.2.3 Rest of South America
- 6.7.3 Europe
- 6.7.3.1 Germany
- 6.7.3.2 United Kingdom
- 6.7.3.3 France
- 6.7.3.4 Italy
- 6.7.3.5 Spain
- 6.7.3.6 Rest of Europe
- 6.7.4 Asia-Pacific
- 6.7.4.1 China
- 6.7.4.2 India
- 6.7.4.3 Japan
- 6.7.4.4 South Korea
- 6.7.4.5 Rest of Asia-Pacific
- 6.7.5 Middle-East and Africa
- 6.7.5.1 United Arab Emirates
- 6.7.5.2 Saudi Arabia
- 6.7.5.3 South Africa
- 6.7.5.4 Turkey
- 6.7.5.5 Rest of Middle-East and Africa
- 6.7.1 North America
7 Competitive Landscape
- 7.1 Market Concentration
- 7.2 Strategic Moves
- 7.3 Market Share Analysis
- 7.4 Company Profiles (Includes Global level Overview, Market level overview, Core Segments, Financials as available, Strategic Information, Market Rank/Share for key companies, Products and Services, and Recent Developments)
- 7.4.1 BYD Company Ltd.
- 7.4.2 Tesla Inc.
- 7.4.3 SAIC Motor
- 7.4.4 Volkswagen AG
- 7.4.5 Hyundai Motor Company
- 7.4.6 Nissan Motor Co. Ltd.
- 7.4.7 Stellantis N.V.
- 7.4.8 Daimler AG (Mercedes-Benz)
- 7.4.9 General Motors
- 7.4.10 Ford Motor Company
- 7.4.11 Toyota Motor Corporation
- 7.4.12 BMW AG
- 7.4.13 Honda Motor Co. Ltd.
- 7.4.14 Volvo Car AB
- 7.4.15 Rivian Automotive LLC
- 7.4.16 Lucid Group Inc.
- 7.4.17 NIO Inc.
- 7.4.18 Tata Motors Ltd.