|
시장보고서
상품코드
2073609
북미의 미량영양소 비료 시장 : 점유율 분석, 업계 동향과 통계, 성장 예측(2026-2031년)North America Micronutrient Fertilizer - Market Share Analysis, Industry Trends & Statistics, Growth Forecasts (2026 - 2031) |
||||||
 Mordor Intelligence
Mordor Intelligence에 의하면, 북미 미량영양소 비료 시장 규모는 2025년 6억 4,000만 달러에서 2026년에는 7억 1,000만 달러로 확대되어 2026년부터 2031년까지 CAGR 7.16%로 성장을 지속하여, 2031년까지 9억 8,000만 달러에 이를 것으로 예측됩니다.
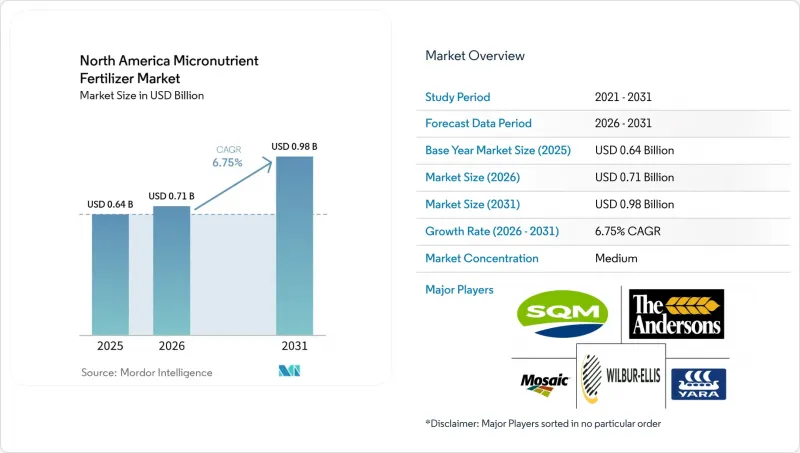
본 보고서는 제품별(붕소, 구리, 아연 등), 형태별(기존 및 특수형), 특수 유형별(액체 비료 등), 시용 방법별(비료 관개, 엽면 시비 등), 작물 유형별(밭작물, 원예작물 등), 지역별(캐나다, 미국 등)로 분류되어 있습니다. 시장 전망은 금액(달러) 및 수량(미터톤) 단위로 제시되어 있습니다.
북미 미량영양소 비료 시장 동향 및 인사이트
토양 검사 결과를 통해 입증된 토양 미량영양소 결핍 증가
검사 보고서에 따르면, 2024년에 검사된 토양의 35%에서 아연 결핍이 확인되었으며, 이는 4년 전의 28%에서 증가한 수치입니다. 아연 결핍이 발생한 옥수수 밭에서는 15-20%의 수확량 손실이 발생하고 있어, 경제적 타격이 두드러지게 나타나고 있습니다. pH 값이 높은 초원의 토양에서는 알칼리성 조건으로 인해 미량영양소가 이용 불가능한 형태로 고정되어 버리기 때문에 이 문제가 더욱 심각해지고 있습니다. 모래질 토양이나 강우량이 많은 지역에서는 침출로 인해 손실이 가속화되기 때문에 붕소 역시 비슷한 경향을 보입니다. 현재 생산자들은 파종 및 비료 시비 작업에 밭별 처방전을 적용하고 있으며, 미량영양소의 시비는 단순한 구제책이 아니라 핵심 요소로 자리 잡고 있습니다. 이 데이터를 바탕으로 한 전환을 통해, 일률적인 NPK 복합비료에서 관찰된 부족분을 보충하는 맞춤형 배합으로의 전환이 가속화되고 있습니다.
미량영양소 수요가 증가함에 따라 유전자 변형 작물의 재배 면적이 확대되고 있습니다.
2024년 기준으로, 미국의 옥수수 재배 면적의 94%, 대두 재배 면적의 96%에서 유전자 변형 형질이 채택되었습니다. 단백질 함량을 높인 새로운 하이브리드 품종은 아연과 망간을 약 25% 더 많이 필요로 하는 반면, 제초제 내성 대두는 화학적 스트레스 하에서도 광합성을 유지하기 위해 더 많은 구리와 철분을 흡수합니다. 종자 제조업체들은 현재 유전자 변형 기술과 영양소 권장량을 세트로 제공하고 있으며, 형질 채택이 확대될 때마다 이 두 가지를 결합한 수요가 발생하고 있습니다. 또한, 포장 시험 결과, 생명공학 품종의 뿌리가 깊게 뻗어 하층토의 양분 저장소에 효율적으로 접근할 수 있는 것으로 밝혀졌으나, 이는 토양 내에 충분히 이용 가능한 미량영양소가 존재하는 경우에 한합니다. 이를 통해 유전적 잠재력을 최대한 끌어내기 위한 영양 공급 프로그램 도입을 위한 기반이 마련되었습니다.
1에이커당 비용 상승 및 일반 NPK 복합비료와의 비교
미량영양소 프로그램의 비용은 1에이커당 35-45달러인 반면, 표준 NPK는 8-12달러로, 300-400% 정도 더 비싸게 느껴집니다. 이로 인해 농산물 가격이 하락할 경우 이익률이 압박을 받게 됩니다. 연간 임대 계약을 체결한 임차인은 계약 기간이 끝난 후에도 지속될 토양 건강에 대한 투자를 주저하는 경향이 있습니다. 현재 일부 보험사들은 부족 사실이 입증된 경우 보상을 제공하는 보험 상품을 출시하며 도입을 장려하고 있지만, 이 제도가 널리 보급되기 위해서는 재활용 붕소와 같은 저비용 공급원, 종자 및 농업 자재 공급업체가 제공하는 인센티브를 결합한 패키지 판매 등이 핵심이 될 것입니다.
부문별 분석
2025년, 아연은 북미 미량영양소 비료 시장에서 24.1%의 점유율을 차지하며 여전히 가장 큰 점유율을 유지했습니다. 이는 pH가 7.5를 초과하는 알칼리성 토양에서는 천연 아연의 이용 가능성이 제한되기 때문입니다. 결핍 증상, 생육 부진, 잎맥 사이의 황변은 생산자가 쉽게 확인할 수 있기 때문에 아연은 표준 혼합 비료에 가장 먼저 첨가되는 미량영양소가 되는 경우가 많습니다. 구리는 전문 농가와 유기농 농가들이 영양 공급과 살균 작용이라는 두 가지 특성을 높이 평가하고 있기 때문에 그 다음으로 큰 점유율을 차지하고 있습니다. 몰리브덴은 배터리 제조업체들이 전 세계 공급망을 긴장시키고 있음에도 불구하고, 콩과 작물의 질소 고정에서 하는 역할이 높이 평가되어 근소한 차이로 그 뒤를 따르고 있습니다. 철은 천연 철분을 고정시켜 버리는 고pH 토양을 대상으로 함으로써 수요가 확보되고 있는 반면, 망간은 유기물이 풍부한 무경운 재배 밭에서 재배되는 대두에 중점을 두고 있습니다.
붕소는 과일 및 채소의 재배 면적이 확대되고, 구매자들이 균일한 결실을 요구함에 따라 2031년까지 연평균 성장률(CAGR)이 7.3%로 가장 빠른 성장세를 보이고 있습니다. 니켈이나 규소와 같은 신흥 원소는 “기타”라는 범주에 속하지만, 집약형 재배 시스템에서 그 가치가 연구를 통해 밝혀짐에 따라 그 중요성이 커지고 있습니다. 혁신의 핵심은 킬레이트화 기술과 분진이 발생하지 않는 과립제에 있으며, 이는 생체 이용률을 높이고 시용량을 줄일 수 있게 해줍니다. 이러한 개선을 통해 광범위한 농지의 비용 부담이 완화될 뿐만 아니라, 고부가가치 작물이 엄격한 품질 기준을 충족하는 데에도 도움이 됩니다. 또한, 각 공급업체들은 여러 가지 결핍증을 동시에 해결하는 다원소 혼합제의 시험도 실시하여, 노동력과 밭 작업 횟수를 줄이려고 노력하고 있습니다. 이러한 변화들이 복합적으로 작용하면서, 아연은 여전히 1위 자리를 유지하고 있지만, 농업 관련 지식이 확산됨에 따라 붕소 및 기타 떠오르는 영양소들이 시장 점유율을 확보할 여지가 생기고 있습니다.
기존의 입상 및 분말 제품은 추가 장비나 교육이 필요하지 않고 기존의 살포기나 파종기에 호환되기 때문에 2025년 매출의 78.0%를 차지했습니다. 낮은 생산 비용과 확립된 공급망 덕분에 가격 경쟁력을 유지하고 있으며, 투입 비용을 1달러 단위로 관리하는 대규모 옥수수 및 대두 농장에게 이는 중요한 요소입니다. 아연, 붕소 또는 이 둘 모두의 결핍을 검사하는 농지가 늘어남에 따라, 이 방법이 꾸준히 보급되고 있음이 분명합니다.
특수 제제는 가장 빠르게 성장하고 있으며, 2031년까지의 연평균 성장률(CAGR)은 6.6%로 전망됩니다. 이는 영양소 이용 효율을 높임으로써 수익성이 향상되는 고급 작물과 정밀 농업 시스템에 의해 주도되고 있습니다. 특수 제품의 경우, 킬레이트화, 서방형 코팅, 다원소 혼합을 적용하여 1파운드당 영양소 공급량을 늘리고 있습니다. 이러한 높은 효율성 덕분에 총 사용량을 줄이고, 밭에서 추가 살포 횟수를 줄임으로써 제품 가격의 높음을 상쇄할 수 있습니다. 원예, 유기농 재배 프로그램 및 제어 환경 시설의 생산자들은 작물의 가치가 높고 품질 기준이 엄격하기 때문에 이러한 프리미엄 가격을 수용하고 있습니다. 또한, 지속적인 제품 혁신은 규제 당국과 구매자 모두에게 우려를 불러일으키고 있는 유출 위험을 줄임으로써 환경 목표 달성을 지원하고 있습니다.
기타 혜택:
- 엑셀 형식 시장 예측(ME) 시트
- 3개월간의 애널리스트 지원
자주 묻는 질문
목차
제1장 서론
제2장 개 보고서의 내용
제3장 주요 요약 및 주요 조사 결과
제4장 주요 업계 동향
제5장 시장 규모와 성장 예측
제6장 경쟁 구도
제7장 비료 업계 CEO를 향한 중요 전략적 과제
JHS 26.07.09According to Mordor Intelligence, the north america micronutrient fertilizer market size is projected to grow from USD 0.64 billion in 2025 to USD 0.71 billion in 2026 and is forecast to reach USD 0.98 billion by 2031 at 7.16% CAGR over 2026-2031.
This report is Segmented by Product (Boron, Copper, Zinc, and More), Form (Conventional and Specialty), Specialty Type (Liquid Fertilizer and More), Application Mode (Fertigation, Foliar, and More), Crop Type (Field Crops, Horticultural Crops, and More), and Geography (Canada, United States, and More). The Market Forecasts are Provided in Terms of Value (USD) and Volume (Metric Tons).
North America Micronutrient Fertilizer Market Trends and Insights
Rising Soil Micronutrient Deficiencies Verified by Soil-Test Results
Laboratory reports show zinc deficiency in 35% of tested soils during 2024, up from 28% four years earlier. Yield losses of 15-20% in deficient corn fields highlight the economic hit. High-pH prairie soils worsen the issue because alkaline conditions lock micronutrients in unavailable forms. Similar trends surface for boron on sandy or high-rainfall sites, where leaching intensifies losses. Growers now integrate site-specific prescriptions into seeding and fertilization runs, making micronutrient application a core element rather than a rescue measure. This data-driven shift hastens movement away from blanket NPK blends toward targeted formulas that close observable gaps.
Expansion of GM-Crop Acreage with Higher Micronutrient Requirements
Ninety-four percent of U.S. corn and 96% of soybean acreage used GM traits in 2024. Newer hybrids with enhanced protein need roughly 25% more zinc and manganese, while herbicide-tolerant soybeans pull more copper and iron to maintain photosynthesis under chemical stress. Seed firms now bundle genetics with nutrient recommendations, creating bundled demand that rides every wave of trait adoption. Field trials also reveal that deeper roots from biotech lines access subsoil stores better, but only when the profile holds enough available micronutrients, setting the stage for supplemental programs that release full genetic potential.
Higher Per-Acre Cost Versus Bulk NPK Blends
Micronutrient programs cost USD 35-45 per acre against USD 8-12 for standard NPK, a 300-400% premium that narrows margins when commodity prices soften. Tenants on annual leases hesitate to invest in soil health that outlives their contracts. Some insurers now offer coverage tied to documented deficiencies, nudging uptake, but widespread relief likely hinges on lower-cost sources such as recycled boron or bundling incentives from seed and input suppliers.
Other drivers and restraints analyzed in the detailed report include:
- Government Subsidies for Precision Micronutrient Application
- Integrated Retailer Distribution Networks Improving Accessibility
- Regulatory Uncertainty on Heavy-Metal Limits in Formulations
For complete list of drivers and restraints, kindly check the Table Of Contents.
Segment Analysis
Zinc retained the largest share of the North America micronutrient fertilizer market in 2025, with 24.1%, because alkaline soils with a pH above 7.5 limit natural zinc availability. Deficiency signs, stunted growth, and interveinal chlorosis are easy for growers to spot, so zinc is often the first micronutrient added to standard blends. Copper followed at a significant share, largely because specialty and organic producers value its dual nutrition and fungicidal traits. Molybdenum ranked close behind, reflecting its role in nitrogen fixation for legume crops even as battery makers tighten global supply lines. Iron is secured by targeting high-pH soils that lock up native iron, while manganese focuses on soybeans grown in no-till fields rich in organic matter.
Boron showed the fastest momentum with a 7.3% CAGR through 2031 as fruit and vegetable acreage expands and buyers demand uniform fruit set. Emerging elements such as nickel and silicon are in the "Others" bucket and are growing in importance as research highlights their value in intensive systems. Innovation centers on chelation chemistries and dust-free granules that raise bioavailability and allow lower application rates. These improvements ease cost pressure in broad-acre programs while helping high-value crops hit strict quality grades. Suppliers also test multi-element mixes that address multiple deficiencies simultaneously, reducing labor and field passes. Together, these shifts keep zinc on top yet open space for boron and other rising nutrients to capture share as agronomic knowledge spreads.
Conventional granular and powder products accounted for 78.0% of 2025 sales because they fit into existing spreaders and planters without additional equipment or training. Lower production costs and established supply chains keep prices competitive, which matters on large corn and soybean farms that track every input dollar. Steady adoption is evident as more fields test for shortfalls in zinc, boron, or both.
Specialty formulations are the fastest-growing, with a 6.6% CAGR through 2031, driven by premium crops and precision systems that reward nutrient-use efficiency. Specialty products use chelation, slow-release coatings, and multi-element blends to deliver more nutrients per pound. This higher efficiency can offset the sticker price by trimming the total rate and cutting extra trips across the field. Growers in horticulture, organic programs, and controlled-environment sites accept the premium because crop value is high and quality standards are tight. Continuous product innovation also supports environmental goals by reducing runoff risk, a growing concern for regulators and buyers alike.
Complete Report Scope:
- Product
- Boron
- Copper
- Iron
- Manganese
- Molybdenum
- Zinc
- Others
- Form
- Conventional
- Specialty
- Specialty Type
- Liquid Fertilizer
- Water Soluble
- Application Mode
- Fertigation
- Foliar
- Soil
- Crop Type
- Field Crops
- Horticultural Crops
- Turf and Ornamental
- Geography
- Canada
- Mexico
- United States
- Rest of North America
List of Companies Covered in this Report:
- The Mosaic Company
- The Andersons Inc.
- Yara International ASA
- Wilbur-Ellis Company LLC
- Sociedad Quimica y Minera de Chile SA
- Nutrien Ltd.
- Compass Minerals International Inc.
- BASF SE
- Helena Agri-Enterprises LLC
- AgroLiquid
- ICL Group Ltd.
- Koch Agronomic Services LLC
- Brandt Consolidated Inc.
- Alltech Crop Science
- Valagro S.p.A.
Additional Benefits:
- The market estimate (ME) sheet in Excel format
- 3 months of analyst support
TABLE OF CONTENTS
1 Introduction
- 1.1 Study Assumptions and Market Definition
- 1.2 Scope of the Study
- 1.3 Research Methodology
2 Report Offers
3 Executive Summary and Key Findings
4 Key Industry Trends
- 4.1 Acreage of Major Crop Types
- 4.1.1 Field Crops
- 4.1.2 Horticultural Crops
- 4.2 Average Nutrient Application Rates
- 4.2.1 Micronutrients
- 4.3 Agricultural Land Equipped for Irrigation
- 4.4 Regulatory Framework
- 4.5 Value Chain & Distribution Channel Analysis
- 4.6 Market Drivers
- 4.6.1 Rising soil micronutrient deficiencies verified by soil-test results
- 4.6.2 Expansion of GM-crop acreage with higher micronutrient requirements
- 4.6.3 Government subsidies for precision micronutrient application
- 4.6.4 Integrated retailer distribution networks improving accessibility
- 4.6.5 Adoption of chelated liquids in indoor and vertical farms
- 4.6.6 E-waste-derived boron lowering input costs
- 4.7 Market Restraints
- 4.7.1 Higher per-acre cost versus bulk NPK blends
- 4.7.2 Regulatory uncertainty on heavy-metal limits in formulations
- 4.7.3 Molybdenum ore supply diverted to battery sector
- 4.7.4 Advisor knowledge gap on nutrient stacking effects
5 Market Size and Growth Forecasts (Value and Volume)
- 5.1 Product
- 5.1.1 Boron
- 5.1.2 Copper
- 5.1.3 Iron
- 5.1.4 Manganese
- 5.1.5 Molybdenum
- 5.1.6 Zinc
- 5.1.7 Others
- 5.2 Form
- 5.2.1 Conventional
- 5.2.2 Specialty
- 5.3 Specialty Type
- 5.3.1 Liquid Fertilizer
- 5.3.2 Water Soluble
- 5.4 Application Mode
- 5.4.1 Fertigation
- 5.4.2 Foliar
- 5.4.3 Soil
- 5.5 Crop Type
- 5.5.1 Field Crops
- 5.5.2 Horticultural Crops
- 5.5.3 Turf and Ornamental
- 5.6 Geography
- 5.6.1 Canada
- 5.6.2 Mexico
- 5.6.3 United States
- 5.6.4 Rest of North America
6 Competitive Landscape
- 6.1 Key Strategic Moves
- 6.2 Market Share Analysis
- 6.3 Company Landscape
- 6.4 Company Profiles (includes Global Level Overview, Market Level Overview, Core Segments, Financials as available, Strategic Information, Market Rank/Share for key companies, Products and Services, and Recent Developments)
- 6.4.1 The Mosaic Company
- 6.4.2 The Andersons Inc.
- 6.4.3 Yara International ASA
- 6.4.4 Wilbur-Ellis Company LLC
- 6.4.5 Sociedad Quimica y Minera de Chile SA
- 6.4.6 Nutrien Ltd.
- 6.4.7 Compass Minerals International Inc.
- 6.4.8 BASF SE
- 6.4.9 Helena Agri-Enterprises LLC
- 6.4.10 AgroLiquid
- 6.4.11 ICL Group Ltd.
- 6.4.12 Koch Agronomic Services LLC
- 6.4.13 Brandt Consolidated Inc.
- 6.4.14 Alltech Crop Science
- 6.4.15 Valagro S.p.A.