
|
시장보고서
상품코드
2119043
중동 및 아프리카의 광고용 주문형 비디오 : 시장 점유율 분석, 산업 동향 및 통계 데이터, 성장 예측(2026-2031년)Middle East and Africa Advertising Video-on-Demand (AVOD) - Market Share Analysis, Industry Trends & Statistics, Growth Forecasts (2026 - 2031) |
||||||
 Mordor Intelligence
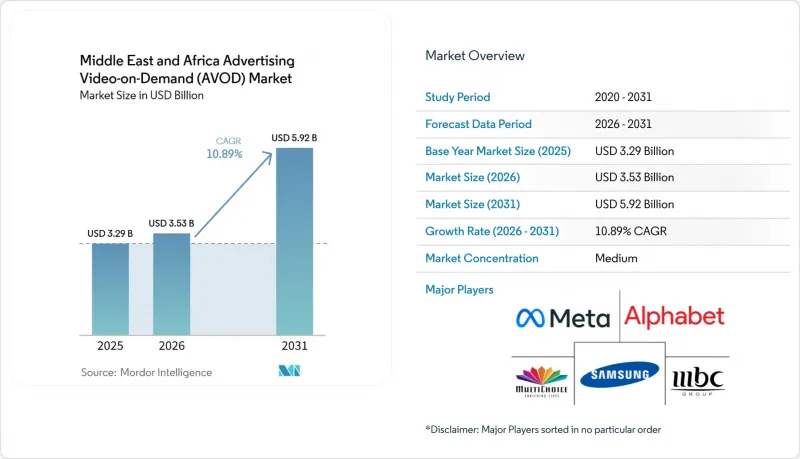
Mordor Intelligence에 의하면, 중동 및 아프리카의 광고용 주문형 비디오 시장 규모는 2025년 32억 9,000만 달러로 평가되었습니다. 2026년에는 35억 3,000만 달러에 이르고2031년까지 59억 2,000만 달러로 확대되어 2026년부터 2031년에 걸쳐 CAGR 10.89%를 나타낼 것으로 예측됩니다.
본 보고서는 컨텐츠 유형(영화, TV 프로그램·에피소드형 컨텐츠, 다큐멘터리 등), 기기 유형(스마트폰·태블릿,스마트 TV, 노트북·데스크톱 PC 등), 최종 사용자(미디어 및 엔터테인먼트, BFSI 등), 광고 형식(프리롤, 미드롤, 포스트롤), 지역별로 분류되어 있습니다. 시장 전망은 금액(달러) 기준으로 제시되어 있습니다.
중동 및 아프리카의 광고용 주문형 비디오 시장 동향 및 인사이트
스마트폰 중심의 동영상 시청 증가
중동 및 아프리카의 광고용 주문형 비디오 시장의 대부분에서 스마트폰은 동영상 시청의 주요 기기로 자리 잡고 있습니다. 노키아의 예측에 따르면, 2029년까지 이 지역의 연결 기기 중 78%를 스마트폰이 차지할 것으로 보이며, 동영상 스트리밍은 모바일 데이터 트래픽의 90%를 차지할 것으로 예측됩니다. 이러한 추세로 인해 무료 모바일 우선 서비스는 유선 광대역이나 정기적인 카드 결제에 의존하는 서비스보다 더 폭넓은 잠재 고객층에 도달할 수 있게 됩니다. YouTube는 그 무료 모델이 다양한 소득층과 기기 유형에서 효과적으로 작동하기 때문에 대규모 도달 범위 측면에서 기준을 확립하고 있습니다. 따라서 경쟁 플랫폼들은 단순히 규모뿐만 아니라 차별화된 컨텐츠, 더 정밀한 타겟팅, 혹은 더 견고한 브랜드 안전 환경을 필요로 합니다. 또한, 이동통신 사업자가 데이터 접속 환경을 개선하면 시청 시간이 늘어남에 따라 이용 가능한 광고 슬롯이 증가하므로, 중동 및 아프리카의 광고용 주문형 비디오 시장도 혜택을 보게 될 것입니다.
CTV 및 프로그래매틱 동영상으로의 광고주 이동
중동 및 아프리카(MENA) 지역의 커넥티드 TV(CTV) 광고는 2025년에 31% 성장하여, 해당 지역에서 가장 빠르게 성장하는 디지털 광고 채널이 되었습니다. UAE 거주자의 일일 스트리밍 이용 및 오픈 인터넷상의 동영상 시청 시간은 프리미엄 스트리밍 노출공급원을 확대되고 있습니다. IAB MENA는 30개 이상의 플랫폼에 걸쳐 CTV 및 OEM(원청 브랜드 제조) 공급이 확대되고 있음을 확인했으나, 구매 방식 및 어트리뷰션에 대해서는 여전히 일관성이 부족합니다. 이러한 변화로 인해 중동 및 아프리카의 광고용 주문형 비디오 시장에서는 표준 디스플레이 광고 슬롯보다 거실에서의 시청을 통해 더 많은 수익을 창출할 수 있게 되었습니다. 덴츠는 2025년 6월, MENA 지역을 위해 엄선된 프로그래매틱 CTV 마켓플레이스를 도입했습니다. 이는 Magnite의 기술을 활용하여 인벤토리, 타겟팅, 측정을 단일 구매 환경으로 통합한 것입니다. 이러한 시스템을 통해 대행사는 프리미엄 동영상을 더 쉽게 구매할 수 있게 되었지만, 일관된 크로스 스크린 측정은 여전히 필요합니다.
아프리카 시장의 낮은 광고 수익률과 CPM의 편차
광고 수익률이 낮기 때문에 중동 및 아프리카의 광고용 주문형 비디오 시장에서는 시청자 수 증가가 수익으로 이어지는 속도가 제한되고 있습니다. YouTube의 재생 CPM은 가나에서 0.75달러, 케냐에서는 1.16달러, 남아프리카공화국에서는 1.72달러인 반면, 미국에서는 6.21달러, 이스라엘에서는 14.08달러입니다. 국내 광고 예산이 적기 때문에 노출당 수익은 보다 성숙한 시장에서 나타나는 수준보다 낮습니다. 나이지리아의 디지털 광고 지출은 2029년까지 전체 광고 지출의 84%를 나타낼 것으로 예측되지만, 데이터 통신비와 경제 상황으로 인해 주요 도시 이외 지역에서의 프리미엄 동영상 보급은 여전히 제한적입니다. 그 결과, 플랫폼 측은 CPM이 낮은 광고 슬롯을 수익화하기 위해 높은 노출 수와 더 강력한 타겟팅을 필요로 하고 있습니다. 아프리카는 절대적인 수익액 면에서는 중동을 밑돌지만, 비율로는 중동보다 빠른 성장이 예상되며, 이로 인해 광고 밀도 측면에서 걸프 지역의 우위가 유지될 것입니다.
부문별 분석
2025년, 중동 및 아프리카의 광고용 주문형 비디오 시장에서 TV 프로그램과 에피소드형 컨텐츠가 35.61%의 점유율을 차지했습니다. 아랍어 에피소드형 컨텐츠와 라마단 기간 동안의 프로그램 편성이 시청 및 광고 수요를 특정 시즌에 집중시킴으로써 이러한 위치를 뒷받침하고 있습니다. Shahid는 2025년 라마단 기간 동안 AVOD 시청 건수가 55.8% 증가했다고 보고하며, 에피소드 방송 일정이 광고 수익에 어떤 영향을 미치는지 보여주고 있습니다. 다큐멘터리는 YouTube상의 사실 기반 프로그램과 디아스포라(해외 거주자)를 위한 ‘노리우드’ 작품 제작 확대에 힘입어 2031년까지 연평균 성장률(CAGR) 11.49%를 나타낼 것으로 예측됩니다.
다큐멘터리는 드라마에 비해 라이선싱 비용을 낮게 유지하면서도 높은 시청 완료율을 유지할 수 있습니다. 영화는 안정적인 역할을 유지하고 있으며, 지역별 서비스에서는 광고 수익이 수반되는 스트리밍에 앞서 극장에서 선공개하고 있습니다. 그 밖의 컨텐츠 유형으로는 숏폼 세로형 동영상이나 스포츠 관련 프로그램 등이 있으며, 이들은 프로그래매틱 프리롤 광고 지출을 유도할 수 있습니다. 2026년 라마단 관련 보고서에 따르면, MENA 지역의 젊은 시청자들은 기존의 30회 분량 형식보다 10-15회 분량의 시리즈를 선호하는 경향이 강해지고 있는 것으로 나타났습니다. 시즌이 짧아짐에 따라 플랫폼은 카탈로그를 더 자주 업데이트할 수 있고, 시즌 도중 광고 슬롯을 배치할 기회도 늘어납니다. 이러한 변화로 인해 광고주는 기존의 라마단 성수기 이외의 시기에도 신선한 프로그램을 보다 안정적으로 공급할 수 있게 됩니다. 또한 컨텐츠 제작팀도 장기간에 걸친 시즌 방송에만 의존하지 않고, 시청자 유지율을 중시한 방송 일정을 계획할 수 있게 됩니다.
2025년, 중동 및 아프리카의 광고용 주문형 비디오 시장 규모 중 스마트폰 및 태블릿이 33.56%를 차지했습니다. 이 점유율은 두 하위 지역에서의 ‘모바일 퍼스트’ 시청 경향과 휴대 단말기의 광범위한 보급을 반영하고 있습니다. 2024년에는 GCC 국가들의 스마트폰 보급률이 90%를 넘어, 사우디아라비아와 UAE에서 장편 컨텐츠 시청을 뒷받침했습니다. 스트리밍 서비스가 TV 운영 체제에 통합됨에 따라, 스마트 TV 시장은 2031년까지 연평균 성장률(CAGR) 11.33%로 확대될 것으로 예측됩니다. 삼성의 조사에 따르면, 2025년 라마단 기간 동안 MENA 지역에서는 이프타르 후 TV 이용률이 42% 상승했으며, 자정 이후에는 최대 80%까지 증가했습니다. 따라서 스마트 TV의 홈 화면은 가정 시청자들에게 스트리밍 서비스로 진입하는 주요 관문이 되고 있습니다.
커넥티드 TV는 시청자가 더 오랜 시간 시청에 몰입하기 때문에 모바일이나 일반 디스플레이보다 가치가 높은 광고를 수용할 수 있습니다. 노트북과 데스크톱 PC는 도시 지역의 비즈니스 사용자와 학생들에게 여전히 중요한 역할을 하고 있습니다. 게임기 및 기타 기기는 특히 고소득 GCC(걸프협력회의) 회원국 가구를 대상으로 하는 소규모 시청자층을 겨냥하고 있습니다. 기기 선택은 플랫폼이 광고를 어떻게 구성할지에도 영향을 미치며, 대형 화면은 긴 광고 시간대나 프리미엄 동영상 형식에 적합합니다. 여러 기기를 병행하여 사용하는 시청자층에 대응하기 위해서는 플랫폼이 모바일, TV, 데스크톱 각 환경에서 시청 경험과 광고 경험의 일관성을 유지해야 합니다.
기타 혜택 :
- 엑셀 형식 시장 예측(ME) 시트
- 3개월간의 애널리스트 지원
자주 묻는 질문
목차
제1장 서론
제2장 분석 방법
제3장 주요 요약
제4장 시장 구도
제5장 시장 규모 및 성장률 예측
제6장 경쟁 구도
제7장 시장 기회 및 향후 전망
KTH 26.09.04According to Mordor Intelligence, the Middle East and Africa advertising video-on-demand (AVOD) market size is projected to expand from USD 3.29 billion in 2025 to USD 3.53 billion in 2026, and to USD 5.92 billion by 2031, registering a CAGR of 10.89% between 2026 and 2031.
This report is Segmented by Content Type (Movies and Films, TV Shows and Episodic Content, Documentaries, and More), Device Type (Smartphones and Tablets, Smart TVs, Laptops and Desktops, and More), End User (Media and Entertainment, BFSI, and More), Ad Format (Pre-Roll, Mid-Roll, and Post-Roll), and Geography. The Market Forecasts are Provided in Terms of Value (USD).
Middle East and Africa Advertising Video-on-Demand (AVOD) Market Trends and Insights
Rising Smartphone-First Video Consumption
Smartphones are the main screen for video viewing across much of the Middle East and Africa advertising video-on-demand market. Nokia expects smartphones to represent 78% of connected devices in the region by 2029, while video streaming is expected to account for 90% of mobile data traffic. This pattern gives free, mobile-first services a wider addressable audience than services that depend on fixed broadband or recurring card payments. YouTube has established the baseline for mass reach because its free model works across varied income levels and device types. Competing platforms, therefore, need differentiated programming, more precise targeting, or a stronger brand-safe environment rather than scale alone. The Middle East and Africa advertising video-on-demand market also benefits when mobile operators improve data access, as longer viewing sessions increase the available advertising inventory.
Advertiser Shift Toward CTV and Programmatic Video
Connected TV advertising in MENA grew 31% in 2025, making it the region's fastest-growing digital advertising channel. Daily streaming use among UAE residents and time spent on open-internet video support a larger pool of premium streaming impressions. IAB MENA identified expanding CTV and original equipment manufacturer supply across more than 30 platforms, although buying methods and attribution remain inconsistent. This shift allows the Middle East and Africa advertising video-on-demand market to earn more from living-room viewing than from standard display placements. Dentsu introduced a curated programmatic CTV marketplace for MENA in June 2025, using Magnite technology to consolidate inventory, targeting, and measurement into a single buying environment. These systems make premium video easier for agencies to buy, even though consistent cross-screen measurement remains necessary.
Low Advertising Yields and Uneven CPMs Across African Markets
Low advertising yields limit how quickly audience growth becomes revenue in the Middle East and Africa advertising video-on-demand market. YouTube playback CPMs range from USD 0.75 in Ghana and USD 1.16 in Kenya to USD 1.72 in South Africa, compared with USD 6.21 in the United States and USD 14.08 in Israel. Lower domestic advertising budgets keep revenue per impression below levels seen in more mature markets. Nigeria's digital advertising spending is projected to reach 84% of total advertising spending by 2029, but data costs and economic conditions still limit the adoption of premium video outside major cities. Platforms consequently require high impression volumes and stronger targeting to make low-CPM inventory profitable. Africa can grow faster in percentage terms than the Middle East while generating less revenue in absolute terms, thereby preserving the Gulf region's lead in advertising density.
Other drivers and restraints analyzed in the detailed report include:
- Growth of Free and Hybrid Streaming Models
- Expansion of Local-Language and Culturally Relevant Content
- Currency Volatility and Low Consumer Purchasing Power
For complete list of drivers and restraints, kindly check the Table Of Contents.
Segment Analysis
TV Shows and Episodic Content held 35.61% of the Middle East and Africa advertising video-on-demand market share in 2025. Arabic serialized drama and the Ramadan programming cycle support this position by concentrating viewing and advertising demand in a seasonal period. Shahid reported a 55.8% increase in AVOD viewing during Ramadan 2025, showing how episode schedules can shape advertising revenue. Documentaries are projected to expand at an 11.49% CAGR through 2031, helped by factual programming on YouTube and growing Nollywood production for diaspora audiences.
Documentaries can offer lower licensing costs than drama while maintaining strong completion rates. Movies and Films retain a stable role, and regional services use cinema-first release windows before advertising-supported distribution. Other Content Types include short-form vertical video and sports-adjacent programming that can attract programmatic pre-roll spending. A 2026 Ramadan report found that younger MENA audiences increasingly prefer 10-15 episode series over traditional 30-episode formats. Shorter seasons let platforms refresh catalogs more often and create additional opportunities for mid-season advertising placements. This change can give advertisers a steadier supply of fresh programming outside the traditional Ramadan peak. It also allows content teams to plan release schedules around audience retention rather than relying only on long seasonal runs.
Smartphones and Tablets accounted for 33.56% of the Middle East and Africa advertising video-on-demand market size in 2025. This share reflects mobile-first viewing across both subregions and the broad availability of handheld screens. Smartphone penetration exceeded 90% in GCC countries in 2024, supporting longer-form viewing in Saudi Arabia and the UAE. Smart TVs are projected to expand at an 11.33% CAGR through 2031 as streaming services are embedded in television operating systems. Samsung found that Ramadan 2025 raised television use in MENA by 42% after Iftar and by up to 80% after midnight. Smart TV home screens, therefore, provide a central route into streaming services for household audiences.
Connected TV can support higher-value advertising than mobile or standard display because viewers are engaged in longer sessions. Laptops and Desktops remain relevant for professional and student users in urban areas. Gaming consoles and other devices serve smaller audience groups, especially in higher-income GCC households. Device choice also affects how platforms package advertising, with large screens better suited to longer commercial breaks and premium video formats. A mixed-device audience requires platforms to keep the viewing and advertising experience consistent across mobile, television, and desktop environments.
Complete Report Scope:
- By Content Type
- Movies and Films
- TV Shows and Episodic Content
- Documentaries
- Other Content Types
- By Device Type
- Smartphones and Tablets
- Smart TVs
- Laptops and Desktops
- Other Device Types
- By End User
- Media and Entertainment
- Retail and E-Commerce
- BFSI
- Education
- Information Technology and Telecommunications
- Healthcare
- Other End Users
- By Ad Format
- Pre-Roll
- Mid-Roll
- Post-Roll
- By Geography
- Middle East
- Saudi Arabia
- United Arab Emirates
- Qatar
- Kuwait
- Bahrain
- Oman
- Turkey
- Rest of Middle East
- Africa
- South Africa
- Nigeria
- Egypt
- Kenya
- Ghana
- Tanzania
- Uganda
- Rest of Africa
- Middle East
List of Companies Covered in this Report:
- Alphabet Inc.
- MBC Group
- Meta Platforms, Inc.
- MultiChoice Group Limited
- Samsung Electronics Co., Ltd.
- STARZPLAY
- PCCW Limited
- OSN Group
- Netflix, Inc.
- Amazon.com, Inc.
- The Walt Disney Company
- beIN Media Group
- Abu Dhabi Media Network
- Watch iT
- stc Group
- TikTok Ltd.
- Snap Inc.
- Roku, Inc.
- Comcast Corporation
- Paramount Global
- Nielsen Holdings plc
- Comscore, Inc.
Additional Benefits:
- The market estimate (ME) sheet in Excel format
- 3 months of analyst support
TABLE OF CONTENTS
1 INTRODUCTION
- 1.1 Study Assumptions and Market Definition
- 1.2 Scope of the Study
2 RESEARCH METHODOLOGY
3 EXECUTIVE SUMMARY
4 MARKET LANDSCAPE
- 4.1 Market Overview
- 4.2 Impact of Macroeconomic Factors on the Market
- 4.3 Market Drivers
- 4.3.1 Rising Smartphone-First Video Consumption
- 4.3.2 Increasing Advertiser Shift Toward CTV and Programmatic Video
- 4.3.3 Expansion of Local-Language and Culturally Relevant Content
- 4.3.4 Growth of Free and Hybrid Streaming Models
- 4.3.5 Ramadan and Event-Led Viewing Concentration
- 4.3.6 Mobile-Money Enabled Monetization in African Markets
- 4.4 Market Restraints
- 4.4.1 Low Advertising Yields and Uneven CPMs Across African Markets
- 4.4.2 Currency Volatility and Low Consumer Purchasing Power
- 4.4.3 Fragmented Measurement, Identity and Data Standards
- 4.4.4 Content Regulation, Censorship and Rights-Clearance Complexity
- 4.5 Industry Value Chain Analysis
- 4.6 Regulatory Landscape
- 4.7 Technological Outlook
- 4.8 Porter's Five Forces Analysis
- 4.8.1 Threat of New Entrants
- 4.8.2 Bargaining Power of Suppliers
- 4.8.3 Bargaining Power of Buyers
- 4.8.4 Threat of Substitutes
- 4.8.5 Competitive Rivalry
5 MARKET SIZE AND GROWTH FORECASTS (VALUE)
- 5.1 By Content Type
- 5.1.1 Movies and Films
- 5.1.2 TV Shows and Episodic Content
- 5.1.3 Documentaries
- 5.1.4 Other Content Types
- 5.2 By Device Type
- 5.2.1 Smartphones and Tablets
- 5.2.2 Smart TVs
- 5.2.3 Laptops and Desktops
- 5.2.4 Other Device Types
- 5.3 By End User
- 5.3.1 Media and Entertainment
- 5.3.2 Retail and E-Commerce
- 5.3.3 BFSI
- 5.3.4 Education
- 5.3.5 Information Technology and Telecommunications
- 5.3.6 Healthcare
- 5.3.7 Other End Users
- 5.4 By Ad Format
- 5.4.1 Pre-Roll
- 5.4.2 Mid-Roll
- 5.4.3 Post-Roll
- 5.5 By Geography
- 5.5.1 Middle East
- 5.5.1.1 Saudi Arabia
- 5.5.1.2 United Arab Emirates
- 5.5.1.3 Qatar
- 5.5.1.4 Kuwait
- 5.5.1.5 Bahrain
- 5.5.1.6 Oman
- 5.5.1.7 Turkey
- 5.5.1.8 Rest of Middle East
- 5.5.2 Africa
- 5.5.2.1 South Africa
- 5.5.2.2 Nigeria
- 5.5.2.3 Egypt
- 5.5.2.4 Kenya
- 5.5.2.5 Ghana
- 5.5.2.6 Tanzania
- 5.5.2.7 Uganda
- 5.5.2.8 Rest of Africa
- 5.5.1 Middle East
6 COMPETITIVE LANDSCAPE
- 6.1 Market Concentration
- 6.2 Strategic Moves
- 6.3 Market Share Analysis
- 6.4 Company Profiles (includes Global Level Overview, Market Level Overview, Core Segments, Financials as available, Strategic Information, Market Rank/Share, Products and Services, Recent Developments)
- 6.4.1 Alphabet Inc.
- 6.4.2 MBC Group
- 6.4.3 Meta Platforms, Inc.
- 6.4.4 MultiChoice Group Limited
- 6.4.5 Samsung Electronics Co., Ltd.
- 6.4.6 STARZPLAY
- 6.4.7 PCCW Limited
- 6.4.8 OSN Group
- 6.4.9 Netflix, Inc.
- 6.4.10 Amazon.com, Inc.
- 6.4.11 The Walt Disney Company
- 6.4.12 beIN Media Group
- 6.4.13 Abu Dhabi Media Network
- 6.4.14 Watch iT
- 6.4.15 stc Group
- 6.4.16 TikTok Ltd.
- 6.4.17 Snap Inc.
- 6.4.18 Roku, Inc.
- 6.4.19 Comcast Corporation
- 6.4.20 Paramount Global
- 6.4.21 Nielsen Holdings plc
- 6.4.22 Comscore, Inc.
7 MARKET OPPORTUNITIES AND FUTURE OUTLOOK
- 7.1 White-space and Unmet-Need Assessment