|
시장보고서
상품코드
2121895
미국의 폐기물 에너지화(WTE) 시장 : 시장 점유율 분석, 업계 동향 및 통계, 성장 예측(2026-2031년)United States Waste To Energy (WTE) - Market Share Analysis, Industry Trends & Statistics, Growth Forecasts (2026 - 2031) |
||||||
 Mordor Intelligence
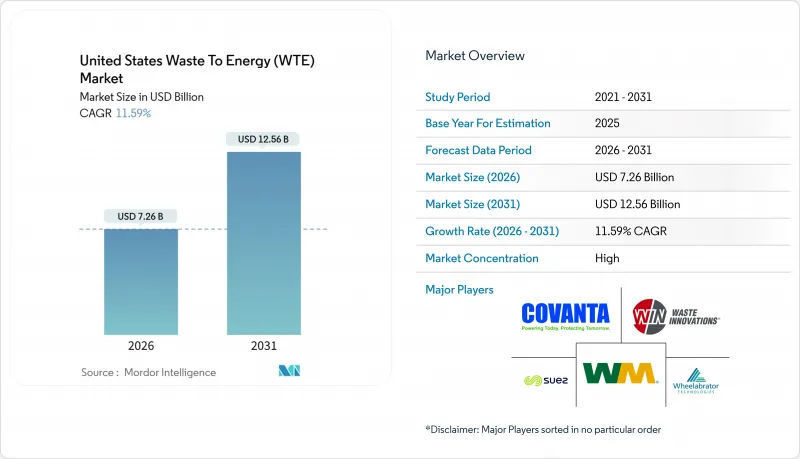
Mordor Intelligence에 의하면, 미국의 폐기물 에너지화 시장 규모는 2026년에 72억 6,000만 달러로 추정되고, 예측 기간(2026-2031년) CAGR 11.59%로 확대될 전망이며, 2031년에는 125억 6,000만 달러에 이를 전망입니다.
본 보고서는 기술별(물리적, 열적, 생물학적), 폐기물 유형별(일반 도시 고형 폐기물, 농업 및 농업 관련 산업의 잔재물 등), 에너지 출력별(전력, 열, 운송용 연료 등), 최종 사용자별(유틸리티 및 독립 발전 사업자(IPP), 운송용 연료 판매업자 등)로 분류되어 있습니다. 시장 규모 및 전망은 금액(달러)으로 표시되어 있습니다.
미국의 폐기물 에너지화(WTE) 시장 동향 및 인사이트
매립지 수용 능력의 포화
2025년, 북동부 지역의 매립 처리 비용은 톤당 100달러를 초과하여 전국 평균의 2배에 달했습니다. 이는 뉴욕주, 뉴저지주, 매사추세츠주, 코네티컷주의 잔여 매립 용량이 10년 분량 미만으로 떨어졌기 때문입니다. 이에 따라 각 지자체는 장거리 운송에 따른 처분 비용을 피할 수 있는 이점과, 재생에너지 크레딧(REC)를 창출하는 지역 폐기물 에너지화 계약을 비교 검토하고 있습니다. 뉴욕주 규제 당국은 27개 매립지 중 14곳이 2033년까지 폐쇄될 가능성이 있다고 경고하고 있으며, 이에 따라 폐기물 처리 시설 전환을 위한 조달이 가속화되고 있습니다. 캘리포니아주의 SB 1383에 따른 유기물 분리 배출 의무화로 인해, 2025년에는 680만 톤의 식품 폐기물 및 정원 수목 폐기물이 재활용되어 혐기성 소화 처리를 위한 안정적인 원료가 확보되었습니다. 운송 비용 절감, 에너지 회수 및 크레딧 수입을 종합적으로 고려할 때, 의사 결정은 폐기물 처리 시설의 전환 쪽으로 기울고 있습니다.
더욱 엄격해진 주별 재생에너지 포트폴리오 기준
코네티컷주, 매사추세츠주, 뉴욕주는 2024-2025년 재생에너지 포트폴리오 기준을 개정하여, 더 엄격한 배출 상한선을 준수하는 적격 폐기물 에너지화소를 대상에 포함시켰습니다. 코네티컷주는 현재 질소산화물(NOx) 배출 수준을 45ppm 미만으로 유지한 시설에 대해 클래스 I 재생에너지 크레딧 발급을 허용하고 있으며, 이를 통해 MWh당 35-42달러의 새로운 수익원이 창출되고 있습니다. 매사추세츠주도 2025년 말에 유사한 지침을 발표하여, 기준을 충족하는 발전소를 ‘대체 에너지’로 재분류함으로써 사업자가 촉매식 배출 제어 장치에 투자하도록 장려하고 있습니다. 이러한 조정으로 인해 프로젝트의 현금 흐름이 개선되어, 기존 송전망에 연결된 기존 사업자에게 유리하게 작용합니다.
PFAS 및 다이옥신 배출에 대한 감시 강화
2025년 9월에 발표된 EPA의 지침안에서는 PFAS 배연 배출 제한이 제안되어, 사업자들은 사이트당 최대 1,200만 달러의 비용이 소요되는 활성탄 주입 시스템 도입을 고려할 수밖에 없게 되었습니다. 뉴욕주는 PFAS 대책이 시행될 때까지 두 개 발전소의 허가 갱신을 일시 중단했습니다. 매사추세츠주와 버몬트주에서는 현재 분기별 PFAS 샘플링 및 결과 공개가 의무화되어 있으며, 이에 따라 허가 유효 기간이 6-9개월 연장되었습니다. 유럽연합(EU)의 기준치인 0.05 ng/m³를 참고한, 보다 엄격한 다이옥신 기준이 미국 규제 당국에 영향을 미치고 있습니다. 규정 준수 비용과 평판 위험이 맞물려 단기 프로젝트의 착수를 방해하고 있습니다.
부문별 분석
2025년 매출의 64.5%를 열처리 시스템이 차지했으나, 생물학적 처리 공정은 2031년까지 연평균 성장률(CAGR) 15.9%를 나타낼 것으로 예측되며, 이는 폐기물 에너지화 시장의 기술 분류 중 가장 높은 성장률입니다. 아나엘기아(Anaelgia)는 2025년 위스콘신주와 아이오와주에서 3기의 농장형 소화조를 가동했습니다. 각 시설은 최대 6만 톤의 가축 배설물을 처리하며, 탄소 강도가 -200 g CO2e/MJ 미만인 재생 가능한 천연가스를 공급하고 있습니다. 또한, 이 생물학적 플랫폼은 프리미엄 크레딧이 부여되는 탄소 음성 분자를 활용하여 가스 포트폴리오의 다각화를 모색하는 유틸리티체들의 자본도 유치하고 있습니다.
에넬켐(Enerchem)이 발렌(Valenne)에서 톤당 300리터의 메탄올 생산량을 입증함에 따라, 개발업자들이 직접 연소 대신 화학 원료 확보를 추구하게 되면서 가스화 및 열분해 프로젝트의 점유율이 확대되고 있습니다. 플라즈마 아크 가스화는 연간 1톤당 자본 집약도가 800달러를 초과하기 때문에 여전히 틈새 분야로 남아 있습니다. 셀룰로오스 기반 에탄올의 발효 경로는 온실가스 배출량을 최소 60% 감축하는 제조 공정을 중시하는 재생 가능 연료 기준(RFS) 할당량이 미국 환경보호청(EPA)에 의해 확정됨에 따라 진전을 이루었습니다. 풀크럼 바이오에너지(Fulcrum Bioenergy)의 시에라 공장은 2025년에 1,100만 갤런을 생산했으며, 2026년 1월 유나이티드 항공과 10년간의 제트 연료 공급 계약을 체결했습니다.
2025년에는 도시 고형 폐기물이 원료의 52.9%를 차지했으나, 농업 잔여물은 2026-2031년 연평균 성장률(CAGR) 14.6%로 확대될 것으로 예상되며, 이는 폐기물 에너지화 시장의 모든 부문 중 가장 높은 성장률입니다. 농장에서의 소화 처리는 주 정부의 저탄소 연료 크레딧 및 연방 정부의 바이오가스 세제 혜택 대상이 되며, 연간 2만 톤 미만의 프로젝트를 지원합니다. 위스콘신주, 아이오와주, 미네소타주에서는 2025년에 총 11기의 농장용 소화 설비가 신설되었으며, 각 시설은 주간 파이프라인에 재생 가능 가스를 공급하여 45Z 생산 크레딧을 획득했습니다.
산업 폐기물의 흐름은 플라스틱을 탈중합하는 화학 재활용 기업에 의해 점점 더 많이 회수되고 있으며, 고발열량 물질은 소각로에서 전용되고 있습니다. 중대서양 지역의 지자체 하수 처리장에서는 수환경연맹(Water Environment Federation)의 모범 사례 매뉴얼에 따라, 음식물 쓰레기와 하수 슬러지의 공동 소화 처리가 확대되고 있습니다. 재활용 선별 기준을 충족하지 못하는 건설 및 해체 목재는 펠릿화되어 시멘트 가마의 혼소에 활용되고 있으며, 이는 미국 산림청의 산불 연료 감축 보조금 취지에 부합하는 것입니다.
기타 혜택 :
- 엑셀 형식 시장 예측(ME) 시트
- 3개월간의 애널리스트 지원
자주 묻는 질문
목차
제1장 서론
제2장 조사 방법
제3장 주요 요약
제4장 시장 구도
제5장 시장 규모 및 성장 예측
제6장 경쟁 구도
제7장 시장 기회 및 향후 전망
AJY 26.09.09According to Mordor Intelligence, the United States waste to energy market size is estimated at USD 7.26 billion in 2026, and is expected to reach USD 12.56 billion by 2031, at a CAGR of 11.59% during the forecast period (2026-2031).
This report is Segmented by Technology (Physical, Thermal, and Biological), Waste Type (Municipal Solid Waste, Agricultural and Agro-Industrial Residues, and More), Energy Output (Electricity, Heat, Transportation Fuels, and More), and End-User (Utilities and IPPs, Transport Fuel Distributors, and More). The Market Sizes and Forecasts are Provided in Terms of Value (USD).
United States Waste To Energy (WTE) Market Trends and Insights
Rising Landfill-Capacity Constraints
Landfill tipping fees in the Northeast topped USD 100 per ton in 2025, twice the national average, because remaining airspace in New York, New Jersey, Massachusetts, and Connecticut fell below a decade of capacity. Municipalities are therefore weighing the avoided cost of long-haul disposal against local waste-to-energy contracts that generate renewable-energy certificates. New York regulators warned that 14 of 27 landfills could close by 2033, accelerating procurement of conversion facilities. California's organic-diversion mandate under SB 1383 redirected 6.8 million tons of food and yard waste in 2025, providing steady feedstock for anaerobic digestion. The combined economics of avoided transport, energy recovery, and credit revenue tilt decision-making toward conversion infrastructure.
Stricter State Renewable Portfolio Standards
Connecticut, Massachusetts, and New York amended renewable-portfolio rules in 2024-2025 to include qualifying waste-to-energy plants that comply with tighter emissions caps. Connecticut now allows Class I renewable-energy certificates for facilities achieving nitrogen-oxide levels below 45 ppm, creating a new USD 35-42 per MWh revenue stream. Massachusetts issued parallel guidance in late 2025 that reclassifies compliant plants as "alternative energy," encouraging operators to invest in catalytic controls. These adjustments improve project cash flow and favor incumbents with existing grid interconnections.
Heightened PFAS & Dioxin Emission Scrutiny
Draft EPA guidance released in September 2025 introduced proposed PFAS stack-emission limits, compelling operators to consider activated-carbon injection systems that add up to USD 12 million per site. New York paused permit renewals for two plants pending PFAS controls. Massachusetts and Vermont now require quarterly PFAS sampling with public disclosure, lengthening permits by six to nine months. Tighter dioxin standards referencing the European Union benchmark of 0.05 ng/m3 are influencing U.S. regulators. Compliance costs and reputational risk combine to hamper near-term project starts.
Other drivers and restraints analyzed in the detailed report include:
- Inflation Reduction Act Tax Credits for WtE Retrofits
- Corporate Zero-Waste Commitments
- Declining MSW Calorific Value Due to Recycling Gains
For complete list of drivers and restraints, kindly check the Table Of Contents.
Segment Analysis
Thermal systems commanded 64.5% of 2025 revenue, yet biological processes are forecast to grow at a 15.9% CAGR through 2031, the highest among technology classes in the waste-to-energy market. Anaergia brought three farm-based digesters online in Wisconsin and Iowa during 2025, each treating up to 60,000 tons of livestock waste and injecting renewable natural gas with carbon intensities below -200 g CO2e/MJ. Biological platforms also attract capital from utilities eager to diversify gas portfolios with carbon-negative molecules that carry premium credits.
Gasification and pyrolysis projects are gaining share as developers seek chemical feedstock rather than direct combustion, following Enerkem's demonstrated methanol yields of 300 L per ton at Varennes. Plasma-arc gasification remains niche owing to capital intensity above USD 800 per annual ton. Fermentation routes for cellulosic ethanol advanced when EPA finalized renewable-fuel-standard volumes that prize pathways reducing greenhouse-gas emissions by at least 60%. Fulcrum BioEnergy's Sierra plant produced 11 million gallons in 2025 and secured a 10-year jet-fuel offtake with United Airlines in January 2026.
Municipal solid waste accounted for 52.9% of feedstock in 2025, yet agricultural residues are expected to expand at a 14.6% CAGR from 2026 to 2031, the fastest of any category in the waste-to-energy market. On-farm digestion qualifies for state low-carbon-fuel credits and federal biogas tax breaks, supporting projects below 20,000 tons per year. Wisconsin, Iowa, and Minnesota collectively added 11 farm digesters in 2025, each injecting renewable gas into interstate pipelines and claiming 45Z production credits.
Industrial waste streams are increasingly intercepted by chemical-recycling firms that depolymerize plastics, diverting high-calorific materials from combustors. Sewage-sludge co-digestion with food waste is rising at municipal wastewater plants in the Mid-Atlantic, guided by Water Environment Federation best-practice manuals. Construction and demolition wood that fails recycling screening is pelletized for cement-kiln co-firing, aligning with U.S. Forest Service wildfire-fuel reduction grants.
Complete Report Scope:
- By Technology
- Physical (Refuse-Derived Fuel, Mechanical Biological Treatment)
- Thermal (Incineration/Combustion, Gasification, Pyrolysis and Plasma-Arc)
- Biological (Anaerobic Digestion, Fermentation)
- By Waste Type
- Municipal Solid Waste
- Industrial Waste
- Agricultural and Agro-industrial Residues
- Sewage Sludge
- Others (Commercial, Construction, Hazardous)
- By Energy Output
- Electricity
- Heat
- Combined Heat and Power (CHP)
- Transportation Fuels (Bio-SNG, Bio-LNG, Ethanol)
- By End-user
- Utilities and IPPs
- Industrial Captive Plants
- District Heating Operators
- Transport Fuel Distributors
List of Companies Covered in this Report:
- Covanta Holding Corp.
- Wheelabrator Technologies Inc.
- WIN Waste Innovations
- SUEZ SA
- Veolia North America
- Waste Management Inc.
- Montenay International
- Martin GmbH
- Babcock & Wilcox Enterprises
- Hitachi Zosen Inova
- Groupe CNIM
- Enerkem
- Fulcrum BioEnergy
- Brightmark
- Aries Clean Energy
- Bioenergy DevCo
- Anaergia
- Green Conversion Systems
- Covanta Environmental Solutions
- Mitsubishi Heavy Industries Environmental & Chemical Engineering
Additional Benefits:
- The market estimate (ME) sheet in Excel format
- 3 months of analyst support
TABLE OF CONTENTS
1 Introduction
- 1.1 Study Assumptions & Market Definition
- 1.2 Scope of the Study
2 Research Methodology
3 Executive Summary
4 Market Landscape
- 4.1 Market Overview
- 4.2 Market Drivers
- 4.2.1 Rising landfill-capacity constraints
- 4.2.2 Stricter state Renewable Portfolio Standards (RPS)
- 4.2.3 Inflation Reduction Act tax credits for WtE retrofits
- 4.2.4 Corporate zero-waste commitments (Fortune 500)
- 4.2.5 High natural-gas price volatility post-2022
- 4.2.6 Novel carbon-negative RDF co-firing pilots
- 4.3 Market Restraints
- 4.3.1 Heightened PFAS & dioxin emission scrutiny
- 4.3.2 Declining MSW calorific value due to recycling gains
- 4.3.3 Local opposition to new incinerators ("not-in-my-back-yard")
- 4.3.4 Rising competition from advanced mechanical recycling
- 4.4 Supply-Chain Analysis
- 4.5 Regulatory Landscape
- 4.6 Technological Outlook
- 4.7 Porter's Five Forces
- 4.7.1 Threat of New Entrants
- 4.7.2 Bargaining Power of Suppliers
- 4.7.3 Bargaining Power of Buyers
- 4.7.4 Threat of Substitutes
- 4.7.5 Industry Rivalry
- 4.8 PESTLE Analysis
5 Market Size & Growth Forecasts
- 5.1 By Technology
- 5.1.1 Physical (Refuse-Derived Fuel, Mechanical Biological Treatment)
- 5.1.2 Thermal (Incineration/Combustion, Gasification, Pyrolysis and Plasma-Arc)
- 5.1.3 Biological (Anaerobic Digestion, Fermentation)
- 5.2 By Waste Type
- 5.2.1 Municipal Solid Waste
- 5.2.2 Industrial Waste
- 5.2.3 Agricultural and Agro-industrial Residues
- 5.2.4 Sewage Sludge
- 5.2.5 Others (Commercial, Construction, Hazardous)
- 5.3 By Energy Output
- 5.3.1 Electricity
- 5.3.2 Heat
- 5.3.3 Combined Heat and Power (CHP)
- 5.3.4 Transportation Fuels (Bio-SNG, Bio-LNG, Ethanol)
- 5.4 By End-user
- 5.4.1 Utilities and IPPs
- 5.4.2 Industrial Captive Plants
- 5.4.3 District Heating Operators
- 5.4.4 Transport Fuel Distributors
6 Competitive Landscape
- 6.1 Market Concentration
- 6.2 Strategic Moves (M&A, Partnerships, PPAs)
- 6.3 Market Share Analysis (Market Rank/Share for key companies)
- 6.4 Company Profiles (includes Global level Overview, Market level overview, Core Segments, Financials as available, Strategic Information, Products & Services, and Recent Developments)
- 6.4.1 Covanta Holding Corp.
- 6.4.2 Wheelabrator Technologies Inc.
- 6.4.3 WIN Waste Innovations
- 6.4.4 SUEZ SA
- 6.4.5 Veolia North America
- 6.4.6 Waste Management Inc.
- 6.4.7 Montenay International
- 6.4.8 Martin GmbH
- 6.4.9 Babcock & Wilcox Enterprises
- 6.4.10 Hitachi Zosen Inova
- 6.4.11 Groupe CNIM
- 6.4.12 Enerkem
- 6.4.13 Fulcrum BioEnergy
- 6.4.14 Brightmark
- 6.4.15 Aries Clean Energy
- 6.4.16 Bioenergy DevCo
- 6.4.17 Anaergia
- 6.4.18 Green Conversion Systems
- 6.4.19 Covanta Environmental Solutions
- 6.4.20 Mitsubishi Heavy Industries Environmental & Chemical Engineering
7 Market Opportunities & Future Outlook
- 7.1 White-space & Unmet-Need Assessment