

|
시장보고서
상품코드
2124484
미국의 기계, 전기, 배관(MEP) 서비스 : 시장 점유율 분석, 업계 동향 및 통계, 성장 예측(2026-2031년)United States (US) MEP Services - Market Share Analysis, Industry Trends & Statistics, Growth Forecasts (2026 - 2031) |
||||||
 Mordor Intelligence
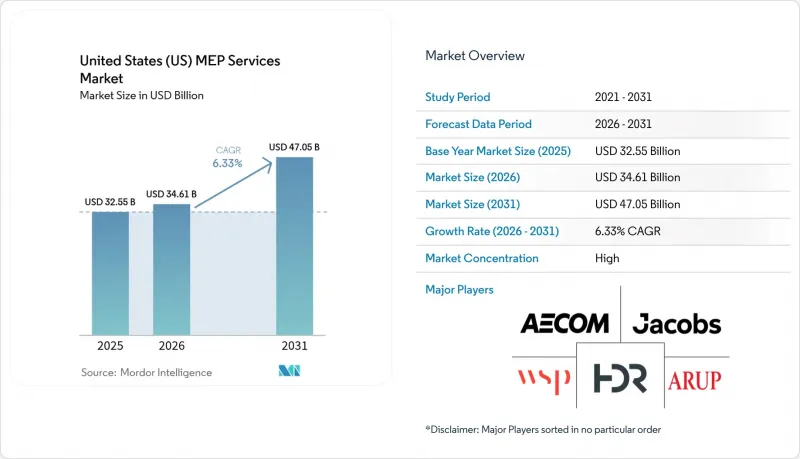
Mordor Intelligence에 의하면, 미국의 기계, 전기, 배관(MEP) 서비스 시장 규모는 2025년 325억 5,000만 달러로 평가되었습니다. 2026년에는 346억 1,000만 달러로 확대되어 2026년부터 2031년에 걸쳐 CAGR 6.33%로 성장을 지속하여, 2031년에는 470억 5,000만 달러에 이를 것으로 예측됩니다.
본 보고서는 유형별(신축, 개보수·리모델링, 기타), 최종 사용자 산업별(의료, 상업용 사무실, 교육 기관, 공공시설, 기타), 서비스 유형별(기계 설비 서비스, 전기 설비 서비스, 배관 설비 서비스)로 분류되어 있습니다. 시장 예측은 금액(달러)으로 표시되어 있습니다.
미국의 기계, 전기, 배관(MEP) 서비스 시장 동향 및 인사이트
핵심 역량에 집중하기 위한 아웃소싱
현재 기계 설비는 건물 에너지 부하의 40-60%를 차지하고 있어, 이에 따라 소유주들은 사내 팀을 유지하는 것보다 전문 업체에 아웃소싱하는 것을 선호하고 있습니다. ServiceTitan과 같은 기술 플랫폼은 계약업체가 종합 건설사의 마진을 거치지 않고 직접 관계를 구축할 수 있도록 지원하고 있으며, Southland Industries가 해당 플랫폼을 도입한 후 생산성을 향상시킨 사례가 이를 입증하고 있습니다. 의료 네트워크는 자본 예산의 더 큰 비중을 전문 파트너에게 할당하고 있으며, 2025년에는 병원 이외의 프로젝트에서 시설 관리비가 27% 증가했습니다. Limbach와 같은 도급업체는 수명 주기 성능을 향상시키는 건물 시스템 솔루션 계약을 통해 지속적인 수익 증가를 보고하고 있습니다.
의료 건설 분야의 지속적인 수요
2024년, 의료 건설 시장은 650억 달러에 달했습니다. 이는 감염 방지 프로토콜과 음압 환기 시스템이 복잡한 기계 설비 사양을 필요로 했기 때문입니다. 애리조나주의 메이요 클리닉 140만 제곱피트 확장 프로젝트와 같은 사례에서는 연중무휴 24시간 가동이 요구되는 이중화된 공조(HVAC), 여과 및 비상 전원 시스템이 필요합니다. 병원 소유주들은 현재 운영 준비가 완료되었음을 입증하기 위해 프로젝트의 80%에서 시운전을 지정하고 있으며, 이로 인해 전문 MEP 컨설턴트에 대한 수요가 확대되고 있습니다.
인력 부족과 임금 상승
베이비붐 세대의 은퇴가 가속화되는 가운데, 이 업계에서는 65만 명의 숙련된 인력이 부족하며, 그 결과 2020년 이후 임금이 20% 상승했습니다. 에너지 관련 직종의 견습생 첫해 평균 급여는 7만 7,000달러에 달하여 공공 부문 계약의 입찰 마진에 압박을 가하고 있습니다. 중서부 지역의 기계 공사 도급업체 중 68%가 기계 공학 관련 직종 채용에 어려움을 호소하고 있으며, 수주 전망이 양호함에도 불구하고 49%의 기업이 프로젝트를 거절할 수밖에 없는 상황에 처해 있습니다.
부문별 분석
2025년에는 건물 소유주들이 규제 변경 가능성에 앞서 연방 정부의 우대 조치를 확보하기 위해 서두른 결과, 개보수 및 리모델링 공사가 기계 설비 서비스 시장의 46.72%를 차지했습니다. 의료 및 공공 부문 프로젝트에서 성능 검증이 의무화됨에 따라, 시운전 및 재시운전은 2031년까지 기계 설비 서비스 시장 규모를 45억 8,000만 달러 확대시켜 연평균 성장률(CAGR) 7.35%를 나타낼 것으로 예측됩니다.
성능 기반 계약에 따라 서비스 범위가 재구성되고 있습니다. 현재 병원 프로젝트의 80%에서 시운전, 에너지 모델링, 유지보수 분석이 단일 계약으로 통합되어 있습니다. 디지털 트윈 도입으로 검증 정확도가 향상되었으며, IFC 기반 워크플로우를 통해 시정 조치 목록이 28% 감소했습니다.
기타 혜택 :
- 엑셀 형식 시장 예측(ME) 시트
- 3개월간의 애널리스트 지원
자주 묻는 질문
목차
제1장 서론
제2장 조사 방법
제3장 주요 요약
제4장 시장 구도
제5장 시장 규모 및 성장 예측
제6장 경쟁 구도
제7장 시장 기회 및 향후 전망
KTH 26.09.14According to Mordor Intelligence, the United States MEP services market size is expected to grow from USD 32.55 billion in 2025 to USD 34.61 billion in 2026 and is forecast to reach USD 47.05 billion by 2031 at 6.33% CAGR over 2026-2031.
This report is Segmented by Type (New Construction, Retrofit and Renovation, and More), End-User Vertical (Healthcare, Commercial Offices, Educational Institutions, Public Facilities, and More), and Service Type (Mechanical Services, Electrical Services, and Plumbing Services). The Market Forecasts are Provided in Terms of Value (USD).
United States (US) MEP Services Market Trends and Insights
Outsourcing Focus on Core Competencies
Mechanical systems now form 40-60% of building energy loads, encouraging owners to outsource to specialist firms rather than carry in-house teams. Technology platforms such as ServiceTitan help contractors build direct relationships that bypass general-contractor markups, evidenced by Southland Industries' productivity gains after adopting the platform. Healthcare networks allocate higher portions of capital budgets to specialized partners, with facilities-management spending on non-hospital projects up 27% in 2025. Contractors like Limbach report recurring revenue increases from building-systems solution contracts that improve lifecycle performance.
Sustained Demand from Healthcare Construction
Healthcare construction reached USD 65 billion in 2024 as infection-control protocols and negative-pressure ventilation drove complex mechanical specifications. Projects such as Mayo Clinic's 1.4 million sq ft expansion in Arizona require redundant HVAC, filtration, and emergency power systems with 24/7 uptime. Hospital owners now specify commissioning on 80% of projects to certify operational readiness, expanding demand for specialized MEP consultants.
Talent Scarcity and Wage Escalation
The sector faces a gap of 650,000 skilled workers as baby-boom retirements accelerate, leading to 20% wage growth since 2020. Apprentice compensation in energy trades averages USD 77,000 in year one, pressuring bid margins for public-sector contracts. Mechanical contractors in the Midwest report 68% difficulty filling mechanical-engineering positions, forcing 49% of firms to decline projects despite strong pipelines.
Other drivers and restraints analyzed in the detailed report include:
- Electrification and HVAC Efficiency Retrofits
- Inflation Reduction Act Tax-Credit Pull-Through
- Small-Firm Margin Squeeze from Design-Build Consolidation
For complete list of drivers and restraints, kindly check the Table Of Contents.
Segment Analysis
Retrofit and renovation captured 46.72% of the mechanical services market share in 2025 as building owners raced to secure federal incentives ahead of potential rule changes. Commissioning and re-commissioning are projected to generate USD 4.58 billion of additional mechanical services market size by 2031, posting a 7.35% CAGR as performance verification becomes mandatory for healthcare and public-sector projects.
Performance-based contracts are reshaping service scopes; eighty percent of hospital projects now bundle commissioning, energy modeling, and maintenance analytics into single awards. Digital-twin adoption accelerates verification accuracy, with IFC-based workflows reducing corrective-action lists by 28%.
Complete Report Scope:
- By Type
- New Construction
- Retrofit and Renovation
- Commissioning / Re-commissioning
- Facility Assessment and Other Services
- By End-user Vertical
- Healthcare
- Commercial Offices
- Educational Institutions
- Public Facilities (Govt, Transport, Museums)
- Industrial and Warehousing
- Data Centers and High-Tech
- By Service Type
- Mechanical Services
- Electrical Services
- Plumbing Services
List of Companies Covered in this Report:
- AECOM Technology Corporation
- Arup Group
- HDR Inc.
- Jacobs Engineering Group Inc.
- WSP USA
- Stantec Inc.
- Affiliated Engineers Inc.
- Syska Hennessy Group
- IMEG Corp.
- Vanderweil Engineers
- KPFF Consulting Engineers
- Burns & McDonnell
- Dewberry Consultants LLC
- TLC Engineering Solutions
- RTM Engineering Consultants
- EXP US Services
- Tetra Tech, Inc.
- C&S Companies
- Simpson Gumpertz & Heger
- WGI Inc.
Additional Benefits:
- The market estimate (ME) sheet in Excel format
- 3 months of analyst support
TABLE OF CONTENTS
1 INTRODUCTION
- 1.1 Study Assumptions and Market Definition
- 1.2 Scope of the Study
2 RESEARCH METHODOLOGY
3 EXECUTIVE SUMMARY
4 MARKET LANDSCAPE
- 4.1 Market Overview
- 4.2 Market Drivers
- 4.2.1 Outsourcing focus on core competencies
- 4.2.2 Sustained demand from healthcare construction
- 4.2.3 Electrification and HVAC efficiency retrofits
- 4.2.4 Inflation Reduction Act tax-credit pull-through
- 4.2.5 Grid-interactive buildings and DER integration needs
- 4.2.6 Growing VC funding for AI-driven MEP design tools
- 4.3 Market Restraints
- 4.3.1 Talent scarcity and wage escalation
- 4.3.2 Small-firm margin squeeze from design-build consolidation
- 4.3.3 Cyber-security liability on smart-building projects
- 4.3.4 Volatile HVAC/R material pricing risk transfer
- 4.4 Value Chain Analysis
- 4.5 Regulatory Landscape
- 4.6 Technological Outlook
- 4.6.1 BIM, Digital Twins and Generative Design
- 4.6.2 Modular MEP Racks and Prefabrication
- 4.7 Porter's Five Forces
- 4.7.1 Bargaining Power of Suppliers
- 4.7.2 Bargaining Power of Buyers
- 4.7.3 Threat of New Entrants
- 4.7.4 Threat of Substitutes
- 4.7.5 Competitive Rivalry
- 4.8 Current Employment Index of US MEP Engineers
5 MARKET SIZE AND GROWTH FORECASTS (VALUES)
- 5.1 By Type
- 5.1.1 New Construction
- 5.1.2 Retrofit and Renovation
- 5.1.3 Commissioning / Re-commissioning
- 5.1.4 Facility Assessment and Other Services
- 5.2 By End-user Vertical
- 5.2.1 Healthcare
- 5.2.2 Commercial Offices
- 5.2.3 Educational Institutions
- 5.2.4 Public Facilities (Govt, Transport, Museums)
- 5.2.5 Industrial and Warehousing
- 5.2.6 Data Centers and High-Tech
- 5.3 By Service Type
- 5.3.1 Mechanical Services
- 5.3.2 Electrical Services
- 5.3.3 Plumbing Services
6 COMPETITIVE LANDSCAPE
- 6.1 Market Concentration
- 6.2 Strategic Moves
- 6.3 Market Share Analysis
- 6.4 Company Profiles (includes Global level Overview, Market level overview, Core Segments, Financials as available, Strategic Information, Market Rank/Share for key companies, Products and Services, and Recent Developments)
- 6.4.1 AECOM Technology Corporation
- 6.4.2 Arup Group
- 6.4.3 HDR Inc.
- 6.4.4 Jacobs Engineering Group Inc.
- 6.4.5 WSP USA
- 6.4.6 Stantec Inc.
- 6.4.7 Affiliated Engineers Inc.
- 6.4.8 Syska Hennessy Group
- 6.4.9 IMEG Corp.
- 6.4.10 Vanderweil Engineers
- 6.4.11 KPFF Consulting Engineers
- 6.4.12 Burns & McDonnell
- 6.4.13 Dewberry Consultants LLC
- 6.4.14 TLC Engineering Solutions
- 6.4.15 RTM Engineering Consultants
- 6.4.16 EXP US Services
- 6.4.17 Tetra Tech, Inc.
- 6.4.18 C&S Companies
- 6.4.19 Simpson Gumpertz & Heger
- 6.4.20 WGI Inc.
7 MARKET OPPORTUNITIES AND FUTURE OUTLOOK
- 7.1 White-space and Unmet-need Assessment


