

|
시장보고서
상품코드
2125532
필리핀의 통신 MNO : 시장 점유율 분석, 업계 동향 및 통계, 성장 예측(2026-2031년)Philippines Telecom MNO - Market Share Analysis, Industry Trends & Statistics, Growth Forecasts (2026 - 2031) |
||||||
 Mordor Intelligence
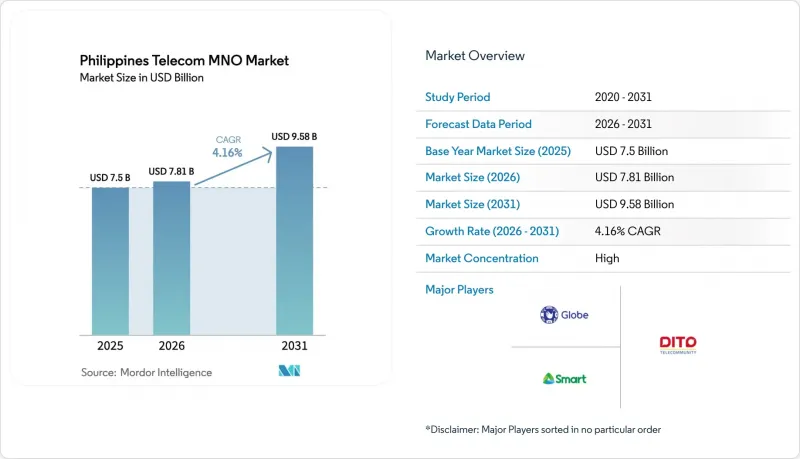
Mordor Intelligence에 의하면, 2026년 필리핀의 통신 MNO 시장 규모는 78억 1,000만 달러로 추정되고 2025년 75억 달러에서 확대해, 2031년에는 95억 8,000만 달러에 이를 것으로 예측됩니다.
2026년부터 2031년까지의 연평균 성장률(CAGR)은 4.16%가 될 것으로 전망됩니다.

본 보고서는 서비스 유형(음성 서비스, 데이터·인터넷 서비스, 메시징 서비스, IoT·M2M 서비스, OTT·유료 TV 서비스, 기타 서비스) 및 최종 사용자(기업, 소비자)별로 분류되어 있습니다. 시장 전망은 금액(달러) 및 수량(가입자 수)으로 제시되어 있습니다.
필리핀의 통신 MNO 시장 동향 및 인사이트
동영상 및 게임 붐에 따른 모바일 데이터 소비량 증가
고화질 스트리밍과 모바일 e스포츠가 주류를 이루면서, 2024년 월평균 데이터 사용량은 8.7 GB에 달하고, 2022년 대비 340%의 급증세를 기록했습니다. 현재 글로브 텔레콤 네트워크에서 저녁 시간대 피크 트래픽의 65%를 동영상이 차지하고 있으며, 이에 따라 이 회사는 가장 혼잡한 LTE 및 5G 기지국의 용량 확충을 가속화하고 있습니다. 또한, 경쟁이 치열한 게임 타이틀의 경우 30밀리초 미만의 지연 시간이 요구되기 때문에 게임이 프리미엄 요금제 가입자 증가에 더욱 박차를 가하고 있습니다. 세계 제공업체들의 스트리밍 컨텐츠 현지화도 이러한 데이터 수요를 뒷받침하고 있으며, 필리핀어로 제작된 오리지널 컨텐츠가 신규 가입자 확보를 촉진하고 있습니다. 이러한 요인들이 맞물려 모바일 데이터는 필리핀의 통신 MNO 시장에서 주요 수익원이 되고 있습니다.
5G 확산 가속화와 단말기 가격 하락
2024년 말까지 Smart Communications는 메트로 마닐라 인구의 95%를 커버했다고 보고했으며, 보급형 5G 단말기 가격이 처음으로 1만 필리핀 페소(175 달러) 아래로 떨어졌습니다. 서비스 범위 확대와 가격 하락이 맞물리면서 5G SIM 카드 이용 건수는 전년 대비 280% 증가했습니다. ‘코넥타돈 피노이 법’에 따른 규제 합리화로 인해 통신 타워 허가 취득 기간이 18개월에서 6개월로 단축되어, 통신 사업자들은 예정보다 빨리 도시의 밀집 지역에서 서비스를 시작할 수 있게 되었습니다. 또한, 단말기 제조업체들도 전자 지갑을 통한 할부 결제 플랜을 도입하여 도입 장벽을 더욱 낮췄습니다. 이러한 동향이 필리핀의 통신 MNO 시장 전망에 반영된 장기적인 수익 확대의 기반이 되고 있습니다.
통신 사업자에게 무거운 5G·광섬유 설비 투자 부담
PLDT는 5G 기지국 밀도를 높이고 교외 지역으로의 FTTH(Fiber-to-the-Home) 확장을 추진하기 위해 2024년에 920억 필리핀 페소(16억 달러)의 설비 투자를 계상했습니다. 이는 서비스 수익의 23%에 해당합니다. 주파수 대역, 백홀, 엣지 네트워크 업그레이드를 포함하면 5G 기지국 1곳당 필요한 자금은 기존 4G 기지국에 비해 40-60% 증가합니다. 향후 예정된 주파수 경매로 인해 수억 달러 규모의 초기 비용이 추가로 발생할 가능성이 있습니다. 그 결과, 통신 사업자들은 ARPU가 높은 지역을 우선시하고 지방의 인프라 구축을 미루고 있어, 보편적 서비스의 진전이 더뎌지고 있습니다.
부문별 분석
모바일 데이터 서비스는 2025년 통신 사업자 수익의 53.46%를 차지하며, 필리핀의 통신 MNO 시장에서 그 주도적인 위상을 입증했습니다. 5G 보급이 얼리 어답터층을 넘어 확산되고, 스트리밍 동영상이 피크 시간대 트래픽 부하의 60% 이상을 차지하게 되면, 이 점유율은 더욱 확대될 전망입니다. 필리핀의 통신 MNO 시장에서 IoT·M2M 서비스에 기인한 시장 규모는 메트로 마닐라의 스마트 시티 전개와 루손 섬의 벼 재배 지역 전역에 걸친 농업 모니터링 프로젝트에 힘입어 연평균 4.28%의 복합 성장률로 확대될 것으로 예측됩니다. 음성 수익은 메신저 앱이 개인 간 통신 트래픽을 흡수하고 있기 때문에 2020년 이후 80% 감소하는 등 구조적인 축소 추세가 이어지고 있습니다.
이에 대응하여 통신 사업자들은 OTT 동영상 및 음악 구독 서비스를 번들로 제공함으로써 고객 참여도를 유지하면서 데이터 통신을 통해 수익을 창출하고 있습니다. 기업용 메시징 API가 전자상거래 주문 현황 알림 및 2단계 인증 분야에서 기존의 SMS를 대체하며 수익 감소를 완화하고 있습니다. 모바일 프라이빗 네트워크(MPN) 및 네트워크 슬라이싱과 같은 신흥 엣지 클라우드 서비스는 향후 기업용 계약의 다음 물결을 뒷받침할 것으로 기대됩니다. 이러한 동향에 따라, 예측 기간 동안 데이터 중심 서비스가 필리핀의 통신 MNO 시장의 성장을 주도할 것으로 확실시됩니다.
기타 혜택 :
- 엑셀 형식 시장 예측(ME) 시트
- 3개월간의 애널리스트 지원
자주 묻는 질문
목차
제1장 서론
제2장 조사 방법
제3장 주요 요약
제4장 시장 구도
제5장 시장 규모 및 성장 예측
제6장 경쟁 구도
제7장 시장 기회 및 향후 전망
KTH 26.09.16According to Mordor Intelligence, the Philippines telecom MNO market size in 2026 is estimated at USD 7.81 billion, growing from 2025 value of USD 7.5 billion with 2031 projections showing USD 9.58 billion, growing at 4.16% CAGR over 2026-2031.
This report is Segmented by Service Type (Voice Services, Data and Internet Services, Messaging Services, Iot and M2M Services, OTT and PayTV Services, Other Services), End User (Enterprises, Consumers). The Market Forecasts are Provided in Terms of Value (USD) and Volume (Subscribers).
Philippines Telecom MNO Market Trends and Insights
Rising mobile-data consumption from video and gaming boom
Average monthly data use climbed to 8.7 GB in 2024, a 340% surge since 2022, as high-definition streaming and mobile esports moved into the mainstream. Video now absorbs 65% of peak evening traffic on Globe Telecom's network, prompting the operator to accelerate capacity upgrades on densest LTE and 5G sites. Gaming contributes a further uplift in premium plan uptake because competitive titles require latency below 30 ms. Localization of streaming catalogs by global providers has reinforced this data pull, with Filipino-language originals boosting subscriber acquisition. Together these factors have made mobile data the dominant revenue line in the Philippines telecom MNO market.
Accelerated 5G roll-out and device affordability
By late-2024 Smart Communications reported 95% population coverage in Metro Manila, while entry-level 5G handsets fell below PHP 10,000 (USD 175) for the first time. The confluence of coverage and cost has driven a 280% year-on-year increase in 5G SIMs. Regulatory streamlining under the Konektadong Pinoy Act trimmed tower-permit lead times from 18 months to 6 months, allowing operators to light up dense urban corridors ahead of schedule. Device manufacturers have also bundled installment schemes through e-wallets, further lowering adoption barriers. These trends underpin the long-run revenue uplift baked into the Philippines telecom MNO market forecasts.
Heavy 5G / fiber capex burden on operators
PLDT allocated PHP 92 billion (USD 1.6 billion) in capex during 2024-23% of service revenue-as it densified 5G radios and pushed fiber-to-the-home deeper into suburbs. Each 5G site needs 40-60% more cash than its 4G predecessor once spectrum, backhaul and edge upgrades are included. Upcoming spectrum auctions may add upfront costs running into hundreds of millions of USD. Consequently, carriers prioritize high-ARPU districts and postpone rural builds, slowing universal-service progress.
Other drivers and restraints analyzed in the detailed report include:
- Government common-tower and spectrum-reform programs
- Enterprise digital-transformation and IoT connectivity demand
- Low rural ARPU limiting ROI
For complete list of drivers and restraints, kindly check the Table Of Contents.
Segment Analysis
Mobile-data services generated 53.46% of 2025 operator revenue, confirming their primacy within the Philippines telecom MNO market. This share will widen as 5G penetration spreads beyond early adopters and as streaming video climbs beyond 60% of peak traffic loads. The Philippines telecom MNO market size attributable to IoT and M2M services is forecast to compound at 4.28% annually, underpinned by smart-city deployments in Metro Manila and agro-monitoring projects across Luzon's rice belt. Voice revenue continues its structural retreat-down 80% since 2020-as messaging apps absorb person-to-person traffic.
In response, operators bundle OTT video and music subscriptions, monetizing data while preserving engagement. Business messaging APIs are replacing legacy SMS for e-commerce order updates and two-factor authentication, mitigating revenue loss. Emerging edge-cloud services such as mobile private networks and network slicing are expected to anchor the next wave of enterprise contracts. These dynamics ensure that data-centric offerings will broaden the Philippines telecom MNO market over the forecast horizon.
Complete Report Scope:
- Overall Telecom Revenue and ARPU
- Service Type
- Voice Services
- Data and Internet Services
- Messaging Services
- IoT and M2M Services
- OTT and PayTV Services
- Other Services (VAS, Roaming and International Services, Enterprise and Wholesale Services, etc.)
- End-User
- Enterprises
- Consumer
List of Companies Covered in this Report:
- Globe Telecom
- Smart Communications
- DITO Telecommunity
Additional Benefits:
- The market estimate (ME) sheet in Excel format
- 3 months of analyst support
TABLE OF CONTENTS
1 INTRODUCTION
- 1.1 Study Assumptions and Market Definition
- 1.2 Scope of the Study
2 RESEARCH METHODOLOGY
3 EXECUTIVE SUMMARY
4 MARKET LANDSCAPE
- 4.1 Market Overview
- 4.2 Regulatory and Policy Framework
- 4.3 Spectrum Landscape and Competitive Holdings
- 4.4 Telecom Industry Ecosystem
- 4.5 Macroeconomic and External Drivers
- 4.6 Porter's Five Forces
- 4.6.1 Competitive Rivalry
- 4.6.2 Threat of New Entrants
- 4.6.3 Bargaining Power of Suppliers
- 4.6.4 Bargaining Power of Buyers
- 4.6.5 Threat of Substitutes
- 4.7 Key MNO KPIs (2020-2025)
- 4.7.1 Unique Mobile Subscribers and Penetration Rate
- 4.7.2 Mobile Internet Users and Penetration Rate
- 4.7.3 SIM Connections by Access Technology and Penetration
- 4.7.4 Cellular IoT / M2M Connections
- 4.7.5 Broadband Connections (Mobile and Fixed)
- 4.7.6 ARPU (Average Revenue Per User)
- 4.7.7 Average Data Usage per Subscription (GB/month)
- 4.8 Market Drivers
- 4.8.1 Rising mobile-data consumption from video and gaming boom
- 4.8.2 Accelerated 5G roll-out and device affordability
- 4.8.3 Government common-tower and spectrum-reform programs
- 4.8.4 Enterprise digital-transformation and IoT connectivity demand
- 4.8.5 Fin-tech super-apps (e.g., GCash) lifting stickiness and ARPU
- 4.8.6 Typhoon-resilient network requirements driving densification
- 4.9 Market Restraints
- 4.9.1 Heavy 5G / fibre capex burden on operators
- 4.9.2 Low rural ARPU limiting ROI
- 4.9.3 SIM Registration Act-driven prepaid de-activations
- 4.9.4 Climate-related outages raising opex and churn risk
- 4.10 Technological Outlook
- 4.11 Analysis of key business models in Telecom
- 4.12 Analysis of Pricing Models and Pricing
5 MARKET SIZE AND GROWTH FORECASTS (VALUE)
- 5.1 Overall Telecom Revenue and ARPU
- 5.2 Service Type
- 5.2.1 Voice Services
- 5.2.2 Data and Internet Services
- 5.2.3 Messaging Services
- 5.2.4 IoT and M2M Services
- 5.2.5 OTT and PayTV Services
- 5.2.6 Other Services (VAS, Roaming and International Services, Enterprise and Wholesale Services, etc.)
- 5.3 End-User
- 5.3.1 Enterprises
- 5.3.2 Consumer
6 COMPETITIVE LANDSCAPE
- 6.1 Market Concentration
- 6.2 Strategic Moves and Investments by key vendors, 2023-2025
- 6.3 Market share analysis for MNOs, 2024
- 6.4 Product Benchmarking Analysis for mobile network services
- 6.5 MNO snapshot (subscribers, churn rate, ARPU, etc.)
- 6.6 Company Profiles* of MNOs (Includes Business Overview | Service Portfolio | Financials | Business Strategy and Recent Developments | SWOT Analysis)
- 6.6.1 Globe Telecom
- 6.6.2 Smart Communications
- 6.6.3 DITO Telecommunity
7 MARKET OPPORTUNITIES AND FUTURE OUTLOOK
- 7.1 White-space and Unmet-Need Assessment


