
|
시장보고서
상품코드
2065484
북미의 데이터센터 GPU 시장 : 시장 점유율 분석, 업계 동향 및 통계, 성장 예측(2026-2031년)North America Data Center GPU - Market Share Analysis, Industry Trends & Statistics, Growth Forecasts (2026 - 2031) |
||||||
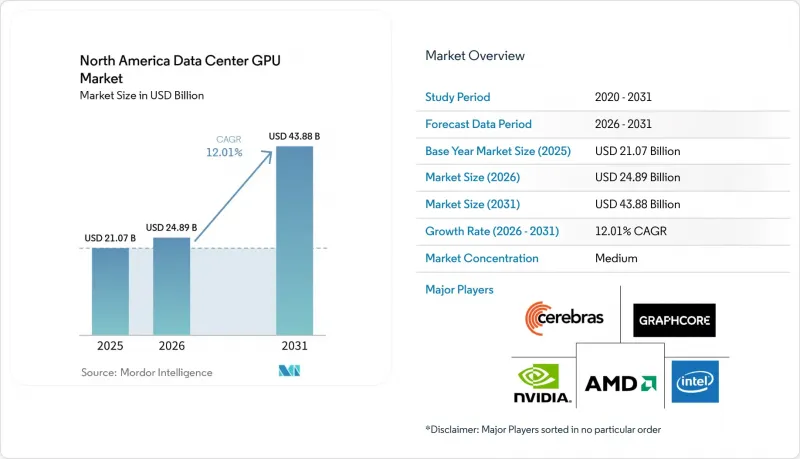
Mordor Intelligence에 의하면, 북미의 데이터센터 GPU 시장 규모는 2026년 248억 9,000만 달러로 평가되었고, 2031년까지 438억 8,000만 달러로 추정되고, 2026-2031년 CAGR 12.01%를 나타낼 것으로 예측되고 있습니다.
본 보고서는 도입 형태별(클라우드 데이터센터 등), GPU 유형별(훈련용 GPU 및 추론용 GPU), 상호 연결 방식별(PCIe 기반 GPU 및 고대역폭 상호 연결 GPU), 워크로드 유형별(AI 및 ML, HPC 등), 최종 사용자별(하이퍼스케일러/CSP, 기업 등), 국가별(미국, 캐나다 등)로 분류되어 있습니다. 시장 전망치는 금액(달러)으로 표시되어 있습니다.
북미의 데이터센터 GPU 시장 동향 및 인사이트
하이퍼스케일 데이터센터에서 AI 및 ML 훈련 워크로드의 급증
각 하이퍼스케일러 기업들은 현재 10만 대 이상의 GPU를 갖춘 클러스터에서 매개변수 수가 1조 개를 넘는 최첨단 모델의 훈련을 진행하고 있습니다. 이러한 규모의 구현을 가능하게 한 것은 올 리듀스의 레이턴시를 수 분에서 수 초로 단축하는 NVLink 패브릭입니다. 2025년 주요 GPU 공급업체들이 기록한 매출액은 실행 1회당 1억 달러를 넘는 모델 예산에 힘입은 수요 사이클을 뒷받침하는 것이었습니다. Solstice나 Equinox와 같은 공공 부문 프로젝트에서는 기후 모델용으로 1만 대 이상의 GPU 클러스터가 도입되면서, 공급업체들의 장기적인 전망이 더욱 밝아지고 있습니다. 운영 담당자들은 용량 계획에 테스트 시 필요한 연산 리소스를 점점 더 많이 반영하고 있으며, 추론 예산이 훈련 예산과 동등한 수준으로 확대됨에 따라 GPU의 수명 주기 요구 사항은 사실상 두 배로 늘어났습니다. 그 결과 발생하는 풀스루 효과로 인해, 첨단 노드의 팹은 풀가동 상태가 유지되고 있으며, HBM 공급 능력을 둘러싼 경쟁이 격화되고 있습니다.
포춘 500대 기업에서 하이브리드 클라우드 전략 도입 확대
기업들은 자사 데이터를 관리하고, 총 지출의 30%를 초과하기도 하는 클라우드 데이터 전송 비용을 피하기 위해 AI 워크로드를 온프레미스 GPU 스택으로 되돌리고 있습니다. 4-64개의 GPU를 탑재하고 SaaS와 같은 관리 기능을 갖춘 턴키 방식의 프라이빗 클라우드 AI 어플라이언스를 통해, 제약, 자동차, 미디어 업계의 기업들은 방화벽 내에서 LLM을 미세 조정할 수 있게 되었습니다. 이 하이브리드 모델은 성숙한 가상화 기술을 기반으로 하며, vGPU 19.0에서는 Blackwell GPU 1개당 48대의 가상 머신을 지원하여 여러 사업 부문에 가속기를 분할하여 활용할 수 있습니다. 계절적 피크 시기에는 처리할 수 없는 작업을 CSP의 용량을 활용해 버스트 처리함으로써, 장기적인 퍼블릭 클라우드에 대한 종속성을 피하면서도 민첩성을 유지하고 있습니다. 이러한 워크로드의 유동성으로 인해 중규모 데이터센터의 잠재 시장이 확대되면서 GPU 임대 수요가 증가하고 있습니다.
선진 노드에서 발생하는 반도체 공급망의 지속적인 제약
첨단 패키징공급 제약이 지속되고 있어, Blackwell 및 Rubin GPU의 리드타임은 현재 50주를 초과하고 있습니다. CoWoS의 생산 능력은 수요를 따라가지 못하고 있으며, HBM3E공급은 2026년까지 주문량을 따라잡지 못하고 있습니다. 각 벤더사는 미국 내 팹 확장을 통해 대응하고 있지만, 생산 확대 일정상 단기적인 공급 완화에는 한계가 있어, 하이퍼스케일러 기업들은 수십억 달러 규모의 사전 구매 계약이나 주식 연계형 거래를 맺을 수밖에 없는 실정입니다. 메타의 6GW 규모 인스팅트 구매 계약에는 AMD 주식 워런트가 포함되어 있어, 고객이 대차대조표의 여유 자금을 활용해 할당량을 확보한 실제 사례가 되고 있습니다. 이와 같은 협상력을 갖추지 못한 스타트업 기업들은 장기화되는 인증 절차와 수익 창출의 지연이라는 과제에 직면해 있습니다.
부문별 분석
2025년, 북미 데이터센터 GPU 시장은 클라우드 시설이 58.90%의 점유율을 차지하며 주도했으나, 대화형 AI, AR, 자율주행차의 추론 처리가 사용자와 가까운 곳으로 이동함에 따라 엣지 노드는 2031년까지 연평균 성장률(CAGR) 13.89%로 성장할 전망입니다. 통신 사업자들이 중앙국에 10-50개의 GPU 포드를 도입하여 지연 시간을 두 자릿수 밀리초 단위로 줄여감에 따라, 엣지 배포용 북미 데이터센터 GPU 시장 규모는 확대되고 있습니다. 수냉식 마이크로 모듈은 소매점이나 캠퍼스 환경에서 소음 및 열 관련 제한 사항을 충족하는 데 도움이 되며, 오케스트레이션 기능이 향상됨에 따라 사업자는 버스트 성향이 강한 멀티테넌트 트래픽에 대응하기 위해 GPU를 분할할 수 있게 되었습니다.
엣지의 확대는 경제적 요인과 물리적 요인을 모두 반영하고 있습니다. 테라바이트 규모의 센서 데이터나 동영상 데이터를 중앙 집중형 클러스터로 백홀하는 비용은 현지에 GPU 용량을 설치하는 비용보다 더 높습니다. 특히 캐나다에서는 장거리 대역폭 가격이 높은 수준을 유지하고 있어 이러한 경향이 두드러집니다. 멀티테넌트형 vGPU 슬라이싱을 통해 중소기업(SMB) 개발자들을 유치할 수 있는 부분 이용 모델이 가능해집니다. 한편, AWS Local Zones나 Azure Edge Zones와 같은 하이퍼스케일러의 전초 기지는 클라우드 관리를 지역의 POP(Point of Presence)까지 확장하고, 클라우드 도구와 엣지의 자율성을 융합하고 있습니다. 이러한 요인들이 복합적으로 작용함에 따라, 예측 기간 동안 엣지 노드는 시범 단계에서 본격적인 운영 규모로 확대될 것입니다.
2025년 매출액 중 훈련용 GPU가 57.82%를 차지했으나, 훈련 후 연산 예산이 증가함에 따라 추론용 가속기는 연평균 성장률(CAGR) 13.45%를 기록하며 이를 상회할 것으로 전망됩니다. 북미 데이터센터의 추론용 하드웨어 GPU 시장 점유율은 Blackwell의 FP4 엔진, MI355X의 288GB HBM3E, 그리고 Gaudi 3의 뛰어난 가성비 덕분에 확대되고 있습니다. 기업들은 생성되는 토큰당 전력 소비량을 절반으로 줄이고, 탄소 배출량 상한 규제 하에서 총 소유 비용(TCO)을 개선하는 추론용 GPU를 선호하고 있습니다.
아키텍처의 수렴으로 인해, 훈련과 서비스 제공의 경계가 점차 모호해지고 있습니다. 통합된 GPU 클러스터는 현재 온디맨드 방식으로 재구성할 수 있으며, Kubernetes는 HBM이 풍부하게 탑재된 노드를 주간에는 퓨샷 미세 조정에, 야간에는 높은 처리량의 추론에 할당하도록 스케줄링하고 있습니다. 테스트 시의 연산 처리, 사고 연쇄형 프롬프팅, 그리고 RLHF 루프를 통해 사용자 쿼리당 추론 사이클 수가 증가하여, 3년 이내에 훈련과 동등한 수요가 발생할 것으로 예측됩니다. 그 결과, 각 벤더들은 실시간 서빙을 위해 메모리 대역폭과 스케줄러의 마이크로우코드를 최적화하고 있으며, 순수한 FLOPs가 아닌 ‘1줄당 토큰 수’를 기준으로 한 성능 지표를 재정의하고 있습니다.
기타 혜택 :
- 엑셀 형식 시장 예측(ME) 시트
- 3개월간의 애널리스트 지원
자주 묻는 질문
목차
제1장 서론
제2장 조사 방법
제3장 주요 요약
제4장 시장 구도
제5장 시장 규모 및 성장 예측
제6장 경쟁 구도
제7장 시장 기회 및 향후 전망
LSHAccording to Mordor Intelligence, the north america data center GPU market size is expected to increase from USD 24.89 billion in 2026 to USD 43.88 billion by 2031, growing at a CAGR of 12.01% over 2026-2031.

This report is Segmented by Deployment Type (Cloud Data Centers, and More), GPU Type (Training GPUs and Inference GPUs), Interconnect (PCIe-Based GPUs and High-Bandwidth Interconnect GPUs), Workload Type (AI and ML, HPC, and More), End-User (Hyperscalers/CSPs, Enterprises, and More), and by Country (United States, Canada, and More). The Market Forecasts are Provided in Value (USD).
North America Data Center GPU Market Trends and Insights
Surging AI and ML Training Workloads in Hyperscale Data Centers
Hyperscalers are now training trillion-parameter frontier models on clusters with more than 100,000 GPUs, a scale unlocked by NVLink fabrics that reduce all-reduce latency from minutes to seconds.Record revenue at a leading GPU vendor in 2025 underscored a demand cycle fueled by model budgets surpassing USD 100 million per run. Public-sector projects such as Solstice and Equinox are adopting 10,000-plus GPU clusters for climate models, reinforcing long-term visibility for suppliers. Operators increasingly factor test-time compute into capacity planning, effectively doubling life-cycle GPU requirements as inference budgets grow to parity with training allocations. The resulting pull-through effect keeps advanced-node fabs fully allocated and intensifies competition for HBM capacity.
Growing Adoption of Hybrid Cloud Strategies Among Fortune 500 Enterprises
Enterprises are repatriating AI workloads to on-premises GPU stacks to control proprietary data and avoid cloud egress fees that can top 30% of total spend. Turnkey private-cloud-AI appliances with 4-64 GPUs and SaaS-like management are enabling firms in pharmaceuticals, automotive, and media to fine-tune LLMs behind their firewalls. The hybrid model is underpinned by mature virtualization, with vGPU 19.0 supporting 48 virtual machines per Blackwell GPU and slicing accelerators for multiple business units. During seasonal peaks, overflow jobs burst into CSP capacity, preserving agility without long-term public-cloud lock-in. This fluidity in workload is expanding the addressable market for mid-sized data centers and fueling demand for GPU leasing.
Persistent Semiconductor Supply-Chain Constraints for Advanced Nodes
Lead times for Blackwell and Rubin GPUs now exceed 50 weeks as advanced packaging remains supply-constrained. CoWoS capacity is short of demand, and HBM3E supply is trailing orders through 2026. Vendors are responding with United States fab expansions, but ramp timelines limit near-term relief, forcing hyperscalers into multi-billion-dollar pre-purchase agreements and equity-linked deals. Meta's 6 GW Instinct commitment secured warrants for AMD shares, illustrating how customers leverage balance-sheet capacity to lock in allocation. Start-ups without similar negotiating leverage face prolonged qualification cycles and postponed revenue.
Other drivers and restraints analyzed in the detailed report include:
- Accelerated Deployment of Generative-AI-Optimized GPU Instances by CSPs
- Expansion of Sovereign Cloud Regions Demanding On-Prem GPU Capacity
- Rising Data Center Electricity Tariffs and Carbon-Emission Regulations
For complete list of drivers and restraints, kindly check the Table Of Contents.
Segment Analysis
Cloud facilities dominated the North America data center GPU market in 2025, accounting for 58.90% share, yet edge nodes will compound at a 13.89% CAGR to 2031 as conversational AI, AR, and autonomous-vehicle inference shift closer to users. The North America data center GPU market size for edge deployments is climbing as telecom carriers deploy 10-50 GPU pods in central offices, shaving latency by double-digit milliseconds. Liquid-cooled micro-modules help meet noise and heat limits in retail and campus environments, while improved orchestration lets operators partition GPUs for bursty multi-tenant traffic.
Edge expansion reflects both economics and physics. Backhauling terabytes of sensor and video data to centralized clusters costs more than placing GPU capacity on-site, especially in Canada, where long-haul bandwidth pricing remains high. Multi-tenant vGPU slicing enables fractional consumption models that attract SMB developers. Meanwhile, hyperscaler outposts such as AWS Local Zones and Azure Edge Zones extend cloud management to regional POPs, blending cloud tools with edge sovereignty. Together, these factors propel edge nodes from pilot to production scale throughout the forecast window.
Training GPUs accounted for 57.82% of 2025 revenue, but inference accelerators will outpace it at a 13.45% CAGR as post-training compute budgets rise. The North America data center GPU market share for inference hardware is widening thanks to FP4 engines in Blackwell, 288 GB HBM3E on MI355X, and Gaudi 3's price-performance profile. Enterprises favor inference GPUs that cut watt-hours per generated token by half, improving TCO under carbon caps.
Architectural convergence blurs boundaries between training and serving. Unified GPU clusters now reconfigure on demand, with Kubernetes scheduling HBM-rich nodes for few-shot fine-tuning by day and high-throughput inference overnight. Test-time compute, chain-of-thought prompting, and RLHF loops increase inference cycles per user query, driving demand parity with training within three years. Consequently, vendors are optimizing memory bandwidth and scheduler microcode for real-time serving, redefining performance metrics around tokens per joule rather than pure FLOPs.
List of Companies Covered in this Report:
- NVIDIA Corporation
- Advanced Micro Devices Inc.
- Intel Corporation
- Graphcore Ltd.
- Cerebras Systems Inc.
- Tenstorrent Inc.
- Qualcomm Technologies Inc.
- Samsung Electronics Co., Ltd.
- Huawei Technologies Co., Ltd.
- Broadcom Inc.
- Marvell Technology Inc.
- Super Micro Computer Inc.
- Dell Technologies Inc.
- Hewlett Packard Enterprise Company
Additional Benefits:
- The market estimate (ME) sheet in Excel format
- 3 months of analyst support
TABLE OF CONTENTS
1 INTRODUCTION
- 1.1 Study Assumptions and Market Definition
- 1.2 Scope of the Study
2 RESEARCH METHODOLOGY
3 EXECUTIVE SUMMARY
4 MARKET LANDSCAPE
- 4.1 Market Overview
- 4.2 Market Drivers
- 4.2.1 Surging AI and ML training workloads in hyperscale data centers
- 4.2.2 Growing adoption of hybrid cloud strategies among Fortune 500 enterprises
- 4.2.3 Accelerated deployment of generative AI-optimized GPU instances by CSPs
- 4.2.4 Expansion of sovereign cloud regions demanding on-prem GPU capacity
- 4.2.5 Rapid emergence of GPU disaggregation and composable infrastructure
- 4.2.6 Availability of energy-efficient liquid-cooled GPU servers lowering TCO
- 4.3 Market Restraints
- 4.3.1 Persistent semiconductor supply-chain constraints for advanced nodes
- 4.3.2 Rising data-center electricity tariffs and carbon-emission regulations
- 4.3.3 Capital-expenditure freeze among SMBs owing to macro uncertainty
- 4.3.4 Vendor lock-in risks tied to proprietary GPU software ecosystems
- 4.4 Industry Value Chain Analysis
- 4.5 Regulatory Landscape
- 4.6 Technological Outlook
- 4.7 Impact of Macroeconomic Factors on the Market
- 4.8 Porter's Five Forces Analysis
- 4.8.1 Threat of New Entrants
- 4.8.2 Bargaining Power of Suppliers
- 4.8.3 Bargaining Power of Buyers
- 4.8.4 Threat of Substitutes
- 4.8.5 Industry Rivalry
5 MARKET SIZE AND GROWTH FORECASTS (VALUE)
- 5.1 By Deployment Type
- 5.1.1 Cloud Data Centers
- 5.1.2 Enterprise / Private Data Centers
- 5.1.3 Edge Data Centers
- 5.2 By GPU Type
- 5.2.1 Training GPUs
- 5.2.2 Inference GPUs
- 5.3 By Interconnect
- 5.3.1 PCIe-Based GPUs
- 5.3.2 High-Bandwidth Interconnect GPUs
- 5.4 By Workload Type
- 5.4.1 Artificial Intelligence (AI) and Machine Learning (ML)
- 5.4.2 High-Performance Computing (HPC) (non-AI scientific computing)
- 5.4.3 Data Analytics (database acceleration, query processing)
- 5.4.4 Graphics and Visualization (VDI, rendering, digital twins)
- 5.5 By End-User
- 5.5.1 Hyperscalers / Cloud Service Providers
- 5.5.2 Enterprises
- 5.5.3 Government and Research Institutions
- 5.6 By Country
- 5.6.1 United States
- 5.6.2 Canada
- 5.6.3 Mexico
6 COMPETITIVE LANDSCAPE
- 6.1 Market Concentration
- 6.2 Strategic Moves
- 6.3 Market Share Analysis
- 6.4 Company Profiles (includes Global Level Overview, Market Level Overview, Core Segments, Financials as available, Strategic Information, Market Rank/Share, Products and Services, Recent Developments)
- 6.4.1 NVIDIA Corporation
- 6.4.2 Advanced Micro Devices Inc.
- 6.4.3 Intel Corporation
- 6.4.4 Graphcore Ltd.
- 6.4.5 Cerebras Systems Inc.
- 6.4.6 Tenstorrent Inc.
- 6.4.7 Qualcomm Technologies Inc.
- 6.4.8 Samsung Electronics Co., Ltd.
- 6.4.9 Huawei Technologies Co., Ltd.
- 6.4.10 Broadcom Inc.
- 6.4.11 Marvell Technology Inc.
- 6.4.12 Super Micro Computer Inc.
- 6.4.13 Dell Technologies Inc.
- 6.4.14 Hewlett Packard Enterprise Company
7 MARKET OPPORTUNITIES AND FUTURE OUTLOOK
- 7.1 White-Space and Unmet-Need Assessment
