
|
시장보고서
상품코드
2065491
미국의 데이터센터용 GPU 시장 : 시장 점유율 분석, 업계 동향 및 통계, 성장 예측(2026-2031년)United States Data Center GPU - Market Share Analysis, Industry Trends & Statistics, Growth Forecasts (2026 - 2031) |
||||||
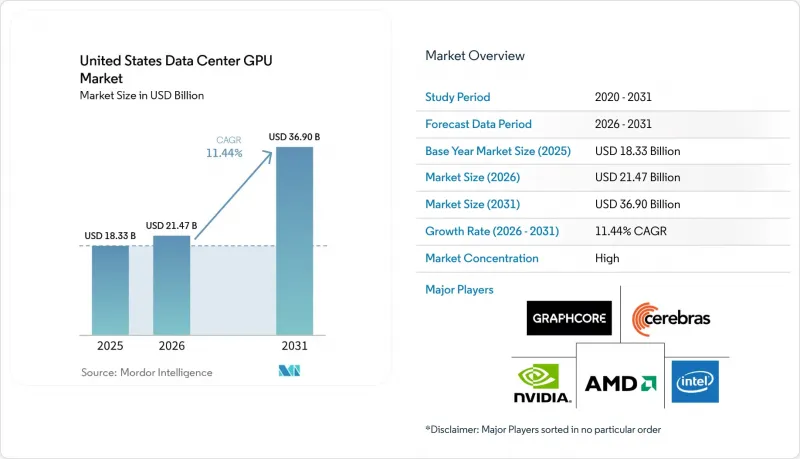
미국의 데이터센터용 GPU 시장 규모는 2025년에 183억 3,000만 달러로 평가되었고, 2026년 214억 7,000만 달러로 추정되고, 2031년까지 369억 달러에 이를 것으로 예측되며, 예측 기간(2026-2031년) CAGR은 11.44%를 나타낼 전망입니다.

본 보고서는 도입 형태별(클라우드 데이터센터, 엔터프라이즈/프라이빗 데이터센터 등), GPU 유형별(훈련용 GPU 및 추론용 GPU), 상호 연결 방식별(PCIe 기반 GPU 및 고대역폭 상호 연결 GPU), 워크로드 유형별(AI 및 ML, HPC, 데이터 분석 등), 그리고 최종 사용자별(하이퍼스케일러/CSP, 기업 등)로 분류되어 있습니다. 시장 전망치는 금액(달러)으로 표시되어 있습니다.
미국의 데이터센터용 GPU 시장 동향 및 인사이트
AI 모델의 복잡성이 증가함에 따라 GPU의 교체 주기가 빨라지고 있습니다.
현재 1조 파라미터 규모의 트랜스포머에는 총 메모리 용량이 10TB를 초과하는 랙 스케일 클러스터가 필요하며, 이로 인해 각 하이퍼스케일러 기업들은 호퍼(Hopper) 시스템을 약 18개월 만에 퇴역시키고, 블랙웰(Blackwell) 및 루빈(Rubin)의 조달 주기를 가속화할 수밖에 없는 상황입니다. NVIDIA의 ‘Vera Rubin NVL72’는 72개의 루빈 GPU와 36개의 베라 CPU를 결합하여 3.6 TB/s의 상호 연결을 구현함으로써, 페타플롭스당 GPU 수를 4분의 1로 줄입니다. 지속적인 에이전트형 워크로드로 인해 투자 초점이 ‘일시적인 훈련 집중 처리’에서 ‘상시 가동되는 추론 플리트’로 이동함에 따라, 스팟 가격보다 예약 인스턴스 계약이 선호되는 추세입니다. OpenAI가 체결한 수년에 걸친 웨이퍼 규모의 계약은 모델 제공업체가 향후 수년 동안 용량을 확보할 수 있음을 보여줍니다. 그 결과, 교체 주기가 단축되면서 사용 빈도가 낮은 GPU의 중고 시장이 활성화되고 있습니다.
고성능 GPU를 뒷받침하는 점점 더 엄격해지는 에너지 효율 규제
미국 환경보호청(EPA)의 ‘ENERGY STAR v4.0’은 대기 상태에서의 전력 소비량에 상한선을 설정하고, PUE를 1.3 미만으로 유지하는 것을 목표로 하고 있어, 이전 세대의 Pascal 및 Volta 그래픽 카드에는 불리한 조건이 되고 있습니다. 또한, 미국 에너지부의 지침에 따르면 GPU 활용도에 대한 분기별 보고가 의무화되어 있으며, 이에 따라 각 기관은 와트당 FP8 성능이 4배 향상된 Blackwell 및 Rubin 디바이스로의 전환을 촉진받고 있습니다. 2026년 1월에 시행될 캘리포니아주의 ‘타이틀 24’에 따르면, GPU 플릿의 평균 성능을 1kW당 50 TFLOPS로 의무화하고 있으며, 이 기준을 충족하는 것은 수냉식 Blackwell 및 AMD MI400 시스템뿐입니다. 각 콜로케이션 제공업체들은 칩 직결형 액체 냉각 시스템으로의 개조를 추진하고 있으며, 이로 인해 버지니아주 북부와 피닉스에서는 임대료 프리미엄이 상승하고 있습니다. 연방 및 주 정부의 규제가 맞물리면서, 시장은 기존의 공랭식 사이트와 차세대 수냉식 캠퍼스로 양분되고 있습니다.
첨단 패키징용 기판공급망 제약
TSMC의 CoWoS 생산 능력은 적어도 2027년까지 월 약 3만 웨이퍼 수준으로 제한될 전망이며, 이로 인해 Blackwell 및 Rubin의 생산량이 주춤하고 있습니다. SK하이닉스는 2025년에 HBM3e의 수율 문제에 직면하여 출하가 최대 12주 지연되었습니다. 수십억 달러 규모의 팹 프로젝트가 진행되고 있음에도 불구하고, ASML의 납기 지연으로 인해 첨단 노드로의 확장이 제한되고 있습니다. 마이크론은 2025년 하반기에 HBM 생산을 시작했으나, 초기 생산량은 데이터센터 수요가 아닌 모바일 시장을 주로 겨냥하고 있습니다. 그 때문에 공급업체들은 이익률이 높은 랙 스케일 시스템을 우선시하고 있어, 중견 기업을 대상으로는 리드타임이 길어지고 있습니다.
부문별 분석
2025년, 미국 내 데이터센터용 GPU 매출액 중 클라우드 데이터센터가 64.76%를 차지했으나, 엣지 데이터센터는 2031년까지 연평균 12.89%의 성장률을 보일 것으로 전망됩니다. 이는 지연 시간에 민감한 추론 워크로드가 중앙 집중식 하이퍼스케일러 시설에서 분산형 엣지 사이트로 이동하고 있음을 반영합니다. AWS, Microsoft Azure, Google Cloud 등의 하이퍼스케일러들은 계속해서 설비 투자를 주도하고 있습니다.
2026년 2월에 출시된 NVIDIA의 ‘Omniverse on DGX Cloud’는 RTX 렌더링 및 저지연 스트리밍에 최적화된 L40 GPU를 탑재하고 있어, 고객이 인프라를 직접 관리할 필요가 없으며, 확장 가능한 GPU 리소스가 필요한 산업의 디지털화 및 디지털 트윈 워크플로우를 대상으로 합니다. 이로 인해 온프레미스 클러스터에 대한 자본 투자를 주저하는 기업들에게 클라우드 관리형 GPU 서비스가 도입의 발판이 되는 입지가 확고해졌습니다. 엣지 데이터센터, 특히 자율주행차 차량군이나 스마트 제조를 지원하는 시설에서는 온도 관리가 되지 않는 환경에서도 가동될 수 있도록, 50-150와트의 열설계전력(TDP)과 수동 냉각 기능을 갖춘 견고한 GPU 서버가 도입되고 있습니다. 이 분야에서는 NVIDIA Jetson과 AMD Radeon PRO 플랫폼이 소프트웨어 생태계의 성숙도와 장기적인 공급 보장을 놓고 경쟁하고 있습니다.
2025년에는 훈련용 GPU가 시장 점유율의 59.88%를 차지했으나, 모델 제공업체들이 자본을 일회성 사전 학습에서 지속적인 에이전트형 워크로드를 처리하는 다년간의 추론용 플릿으로 전환함에 따라, 추론용 GPU는 2031년까지 연평균 12.77%의 성장률을 보일 것으로 예측됩니다. 그 경제적 논리는 간단명료합니다. 1조 개의 매개변수를 가진 모델을 초기 훈련하는 데는 5,000만-1억 달러와 1만-2만 대의 GPU가 필요하지만, 해당 모델을 대규모로 운영하려면 운영 기간 동안 5-10배의 추론 능력이 필요하며, 이는 하이퍼스케일러와 모델 개발자에게 있어 자본 배분 계산식을 근본적으로 바꾸게 될 것입니다. NVIDIA의 ‘Groq 3 LPX’ 추론 랙은 256개의 언어 처리 유닛, 128기가바이트의 온칩 SRAM, 그리고 초당 40페타바이트의 총 대역폭을 통합하고 있으며, 서브밀리초 수준의 응답 시간을 통해 프리미엄 가격대를 실현하는 에이전트형 추론 워크로드를 위한 저지연 토큰 생성을 목표로 하고 있습니다.
훈련용 GPU는 여전히 기반 모델 개발이나 훈련 후 미세 조정 과정에서 필수적이지만, 새로운 모델의 출시 속도는 둔화되고 있으며, GPT-5나 Llama 4의 훈련 기간은 이전 세대의 6-9개월에 비해 12-18개월에 달하는 것으로 나타났습니다. 이로 인해 훈련 클러스터의 지속적인 확장에 대한 시급성은 줄어들었고, 하이퍼스케일러는 훈련 인프라 비용을 더 오랜 기간에 걸쳐 상각할 수 있게 되었습니다. 사전 학습의 규모에만 의존하는 것이 아니라, 추론 중에 모델이 반복적으로 출력을 미세 조정하는 ‘추론 시 연산 스케일링’의 등장으로 인해, 훈련과 추론의 워크로드 경계가 모호해지면서, 높은 처리량을 자랑하는 배치 훈련과 낮은 지연 시간을 가진 대화형 추론을 모두 지원하는 하이브리드 GPU 아키텍처에 대한 수요가 높아지고 있습니다.
기타 혜택 :
- 엑셀 형식 시장 예측(ME) 시트
- 3개월간의 애널리스트 지원
자주 묻는 질문
목차
제1장 서론
제2장 조사 방법
제3장 주요 요약
제4장 시장 구도
제5장 시장 규모 및 성장 예측
제6장 경쟁 구도
제7장 시장 기회 및 향후 전망
AJY 26.06.26According to Mordor Intelligence, the united states data center GPU market size was valued at USD 18.33 billion in 2025 and estimated to grow from USD 21.47 billion in 2026 to reach USD 36.90 billion by 2031, at a CAGR of 11.44% during the forecast period (2026-2031).
This report is Segmented by Deployment Type (Cloud Data Centers, Enterprise / Private Data Centers, and More), GPU Type (Training GPUs and Inference GPUs), Interconnect (PCIe-Based GPUs and High-Bandwidth Interconnect GPUs), Workload Type (AI and ML, HPC, Data Analytics, and More), and End-User (Hyperscalers/CSPs, Enterprises, and More). The Market Forecasts are Provided in Value (USD).
United States Data Center GPU Market Trends and Insights
Growing AI Model Complexity Driving GPU Refresh Cycles
Trillion-parameter transformers now demand rack-scale clusters with aggregate memory exceeding 10 TB, pushing hyperscalers to retire Hopper systems after roughly 18 months and to accelerate Blackwell and Rubin procurement cycles. NVIDIA's Vera Rubin NVL72 couples 72 Rubin GPUs with 36 Vera CPUs, delivering a 3.6 TB/s interconnect that cuts GPU counts by one-quarter per petaflop. Continuous agentic workloads have shifted spending from one-time training bursts to always-on inference fleets, favoring reserved-instance contracts over spot pricing. OpenAI's multi-year wafer-scale deal demonstrates how model providers can lock in capacity years in advance. The result is a shortened refresh cadence that strengthens secondary markets for lightly used GPUs.
Escalating Energy Efficiency Mandates Favoring Advanced GPUs
The Environmental Protection Agency's ENERGY STAR v4.0 caps idle power and targets PUE below 1.3, disadvantaging legacy Pascal and Volta cards. Department of Energy guidelines now require quarterly reporting of GPU utilization, nudging agencies toward Blackwell and Rubin devices that quadruple FP8 performance per watt. California Title 24, effective January 2026, mandates GPU fleet averages of 50 TFLOPS per kilowatt, a level only liquid-cooled Blackwell and AMD MI400 systems meet. Colocation providers are retrofitting with direct-to-chip liquid cooling, raising rent premiums in Northern Virginia and Phoenix. Together, federal and state rules are splitting the market into legacy air-cooled sites and next-generation liquid-cooled campuses.
Supply Chain Constraints for Advanced Packaging Substrates
TSMC's CoWoS capacity remains capped at around 30,000 wafers per month until at least 2027, slowing Blackwell and Rubin's output. SK hynix experienced HBM3e yield issues in 2025, delaying shipments by up to 12 weeks. ASML delivery backlogs limit advanced-node expansion despite multibillion-dollar fab projects. Micron entered HBM production in late 2025, yet early volumes are targeted at mobile rather than data center demand. Vendors therefore prioritize the highest-margin rack-scale systems, leaving mid-market enterprises with prolonged lead times.
Other drivers and restraints analyzed in the detailed report include:
- Proliferation of Edge Inference Accelerating Low-Latency GPU Demand
- Adoption of Cloud-Native HPC Workflows in Enterprise Research and Development
- Rising Total Cost of Ownership Versus ASIC Alternatives for Inference
For complete list of drivers and restraints, kindly check the Table Of Contents.
Segment Analysis
Cloud data centers accounted for 64.76% of United States data center GPU revenue in 2025, yet edge data centers are forecast to grow at 12.89% annually through 2031, reflecting the migration of latency-sensitive inference workloads from centralized hyperscaler facilities to distributed edge sites. Hyperscalers such as AWS, Microsoft Azure, and Google Cloud continue to dominate capital expenditure.
NVIDIA's Omniverse on DGX Cloud, launched in February 2026 with optimized L40 GPUs for RTX rendering and low-latency streaming, targets industrial digitalization and digital twin workflows that require scalable GPU resources without customer infrastructure management, positioning cloud-managed GPU services as an on-ramp for enterprises hesitant to commit capital to on-premise clusters. Edge data centers, particularly those supporting autonomous vehicle fleets and smart manufacturing, are deploying ruggedized GPU servers with 50-150 watt thermal envelopes and passive cooling to operate in non-climate-controlled environments, a segment where NVIDIA Jetson and AMD Radeon PRO platforms compete on software ecosystem maturity and long-term supply commitments.
Training GPUs commanded 59.88% of market share in 2025, yet inference GPUs are forecast to grow at 12.77% annually through 2031 as model providers shift capital from one-time pretraining toward multi-year inference fleets that serve continuous agentic workloads. The economic logic is straightforward: a trillion-parameter model requires USD 50-100 million and 10,000-20,000 GPUs for initial training, but serving that model at scale demands 5-10x more inference capacity over its operational lifetime, fundamentally altering the capital allocation calculus for hyperscalers and model builders. NVIDIA's Groq 3 LPX inference rack, integrating 256 language processing units with 128 gigabytes of on-chip SRAM and 40 petabytes per second of aggregate bandwidth, targets low-latency token generation for agentic reasoning workloads where sub-millisecond response times unlock premium pricing tiers.
Training GPUs remain essential for foundation model development and post-training fine-tuning, yet the cadence of new model releases is slowing GPT-5 and Llama 4 training runs are stretching to 12-18 months versus 6-9 months for prior generations, reducing the urgency of continuous training cluster expansion and allowing hyperscalers to amortize training infrastructure over longer periods. The emergence of test-time compute scaling, where models iteratively refine outputs during inference rather than relying solely on pretraining scale, is blurring the boundary between training and inference workloads and driving demand for hybrid GPU architectures that support both high-throughput batch training and low-latency interactive inference.
List of Companies Covered in this Report:
- NVIDIA Corporation
- Advanced Micro Devices, Inc.
- Intel Corporation
- Qualcomm Technologies, Inc.
- Alphabet Inc. (Google Cloud TPU ecosystem)
- Amazon Web Services, Inc.
- Microsoft Corporation
- Meta Platforms, Inc.
- IBM Corporation
- Graphcore Ltd.
- Cerebras Systems Inc.
- Marvell Technology, Inc.
- Samsung Electronics Co., Ltd.
Additional Benefits:
- The market estimate (ME) sheet in Excel format
- 3 months of analyst support
TABLE OF CONTENTS
1 INTRODUCTION
- 1.1 Study Assumptions and Market Definition
- 1.2 Scope of the Study
2 RESEARCH METHODOLOGY
3 EXECUTIVE SUMMARY
4 MARKET LANDSCAPE
- 4.1 Market Overview
- 4.2 Market Drivers
- 4.2.1 Growing AI Model Complexity Driving GPU Refresh Cycles
- 4.2.2 Escalating Energy Efficiency Mandates Favoring Advanced GPUs
- 4.2.3 Proliferation of Edge Inference Accelerating Low-latency GPU Demand
- 4.2.4 Adoption of Cloud-native HPC Workflows in Enterprise R&D
- 4.2.5 Emergence of Multi-tenant GPU Virtualization Platforms
- 4.2.6 U.S. Government Incentives For Domestic Semiconductor Capacity
- 4.3 Market Restraints
- 4.3.1 Supply Chain Constraints For Advanced Packaging Substrates
- 4.3.2 Rising Total Cost of Ownership Versus ASIC Alternatives For Inference
- 4.3.3 Data Center Power and Cooling Bottlenecks in Legacy Facilities
- 4.3.4 Geopolitical Export Controls Limiting GPU Availability To Certain Users
- 4.4 Industry Value Chain Analysis
- 4.5 Regulatory Landscape
- 4.6 Technological Outlook
- 4.7 Impact of Macroeconomic Factors on the Market
- 4.8 Porter's Five Forces Analysis
- 4.8.1 Threat of New Entrants
- 4.8.2 Bargaining Power of Suppliers
- 4.8.3 Bargaining Power of Buyers
- 4.8.4 Threat of Substitutes
- 4.8.5 Industry Rivalry
5 MARKET SIZE AND GROWTH FORECASTS (VALUE)
- 5.1 By Deployment Type
- 5.1.1 Cloud Data Centers
- 5.1.2 Enterprise / Private Data Centers
- 5.1.3 Edge Data Centers
- 5.2 By GPU Type
- 5.2.1 Training GPUs
- 5.2.2 Inference GPUs
- 5.3 By Interconnect
- 5.3.1 PCIe-Based GPUs
- 5.3.2 High-Bandwidth Interconnect GPUs
- 5.4 By Workload Type
- 5.4.1 Artificial Intelligence (AI) and Machine Learning (ML)
- 5.4.2 High-Performance Computing (HPC) (non-AI scientific computing)
- 5.4.3 Data Analytics (database acceleration, query processing)
- 5.4.4 Graphics and Visualization (VDI, rendering, digital twins)
- 5.5 By End-User
- 5.5.1 Hyperscalers / Cloud Service Providers
- 5.5.2 Enterprises
- 5.5.3 Government and Research Institutions
6 COMPETITIVE LANDSCAPE
- 6.1 Market Concentration
- 6.2 Strategic Moves
- 6.3 Market Share Analysis
- 6.4 Company Profiles (includes Global Level Overview, Market Level Overview, Core Segments, Financials as available, Strategic Information, Market Rank/Share, Products and Services, Recent Developments)
- 6.4.1 NVIDIA Corporation
- 6.4.2 Advanced Micro Devices, Inc.
- 6.4.3 Intel Corporation
- 6.4.4 Qualcomm Technologies, Inc.
- 6.4.5 Alphabet Inc. (Google Cloud TPU ecosystem)
- 6.4.6 Amazon Web Services, Inc.
- 6.4.7 Microsoft Corporation
- 6.4.8 Meta Platforms, Inc.
- 6.4.9 IBM Corporation
- 6.4.10 Graphcore Ltd.
- 6.4.11 Cerebras Systems Inc.
- 6.4.12 Marvell Technology, Inc.
- 6.4.13 Samsung Electronics Co., Ltd.
7 MARKET OPPORTUNITIES AND FUTURE OUTLOOK
- 7.1 White-Space and Unmet-Need Assessment
