
|
시장보고서
상품코드
2113286
중국의 석유 및 가스 : 시장 점유율 분석, 업계 동향과 통계, 성장 예측(2026-2031년)China Oil And Gas - Market Share Analysis, Industry Trends & Statistics, Growth Forecasts (2026 - 2031) |
||||||
 Mordor Intelligence
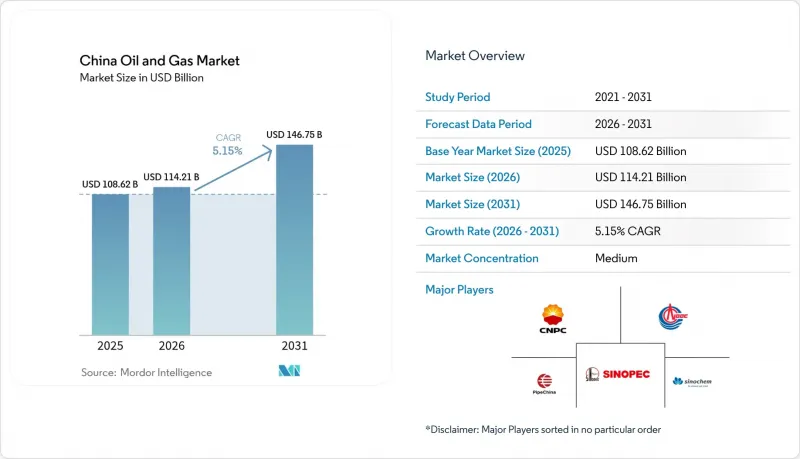
Mordor Intelligence에 따르면 2026년 중국의 석유 및 가스 시장 규모는 1,142억 1,000만 달러로 추정되고 있으며, 2025년 1,086억 2,000만 달러에서 확대하며, 2031년의 예측치는 1,467억 5,000만 달러로, 2026-2031년에 CAGR 5.15%로 성장할 것으로 전망되고 있습니다.
이 보고서는 부문(상류 부문, 중류 부문, 하류 부문), 위치(육상, 해상), 서비스(건설, 유지보수·턴어라운드, 해체)별로 분류되어 있습니다. 시장 규모와 예측치는 금액(달러)으로 표시되어 있습니다.
중국 석유 및 가스 시장의 동향 및 인사이트
에너지 안보 추진 및 수입 대체 의무화
중국 정부는 원유 생산량을 연간 2억 톤 이상으로 유지할 것을 의무화하고 있으며, 이를 통해 현재 수요의 73%를 차지하는 수입 의존도를 낮추고 있습니다. 중국석유천연가스그룹(CNPC)과 중국석유화학(Sinopec)은 인필 시추를 위해 정책은행으로부터 저비용 자금을 확보하고 있는 반면, 중국해양석유(CNOOC)는 매장량의 다각화를 도모하기 위해 해양 탐사를 가속화하고 있습니다. 전략적 석유 비축량 확대를 통해 국내 공급이 보장되고 있으며, 현지 조달률 의무화로 인해 중국산 시추 장비, 펌프, 해저 앰빌리컬의 조달이 촉진되고 있습니다. 석유화학 제조업체들은 국내산 나프타 및 에탄의 인수 계약을 늘려, 휘발유 판매가 정체된 상황에서도 기준 소비량을 확보하고 있습니다. 이러한 조치들이 어우러져 가격 충격으로부터 중국의 석유 및 가스 시장을 보호하는 ‘안전 프리미엄’의 기반이 되고 있습니다.
‘이중 순환’ 전략에 따른 석유화학 원료 수요
중국의 경제 기획 담당자들은 더 많은 원유를 방향족 화합물이나 올레핀으로 전환하는 통합형 정유·화학 단지에 투자를 유도하고 있으며, 이를 통해 운송용 연료 이외의 탄화수소 수요를 끌어올리고 있습니다. 중국해양석유(CNOOC)의 다시다오 공장을 개보수함에 따라 원유 처리 능력은 50% 향상되었고, 화학 제품 수율은 2배로 증가했습니다. 이는 광둥성과 장쑤성에서 진행 중인 설비 현대화 작업과 맥을 같이합니다. 2024년에는 국내 에틸렌 생산량이 12% 증가하여 내륙 분지에서 발생하는 잉여 콘덴세이트와 LPG 공급을 흡수했습니다. 석유화학 원료의 계약 기간은 보통 5년으로, 생산자에게 예측 가능한 현금 흐름을 제공할 뿐만 아니라 에너지 전환의 변혁기에도 중국의 석유 및 가스 시장을 안정시키고 있습니다.
상류 부문 대기업에 대한 폭리세
단계적 과세 제도에 따라 고가 사이클에서 발생하는 예외적인 이익이 줄어들면서, 중국석유(CNPC), 중국석화(Sinopec), 중국해양석유(CNOOC)의 재투자 예산이 축소되고 있습니다. 경영진은 투자 회수 기간이 짧은 핵심 블록을 우선시하고, 수익성이 낮은 외곽 유정의 개발을 연기하고 있습니다. 이 세제는 CCS(탄소 포집 및 저장)에 대한 지출 증가와 시기가 겹치며, 현금 흐름에 대한 압박을 가중시키는 동시에 중국 석유 및 가스 시장의 확장을 다소 억제하고 있습니다.
부문별 분석
2025년, 중국 석유 및 가스 시장 점유율의 70.88%를 상류 부문이 차지하고 있으며, 이는 보하이, 남중국해, 오르도스 지역에서 국가 자금을 통한 적극적인 탐사에 힘입은 결과입니다. 한편, 하류 부문은 2031년까지 연평균 성장률(CAGR) 5.44%로 시장 성장을 주도할 것으로 예측됩니다. 통합형 대기업은 AI를 활용한 지진파 역분석 기술을 통해 탐사 주기 시간을 20% 단축함으로써 상류 부문에서의 우위를 강화하고 있습니다.
상류 부문의 투자는 성숙한 광구에서 회수율을 향상시키는 저류층 관리 툴에 중점을 두고 있습니다. 생산정에서의 탄소 포집 시범 사업에서는 고갈된 지층에 CO₂를 저장함으로써, 더욱 엄격한 배출 규제 하에서도 증산이 가능해집니다. 하류 부문에서는 전기자동차(EV)의 보급에 따라 휘발유 크랙 마진이 축소되고 있지만, 방향족 화합물의 마진은 견고한 추세를 보이고 있으며, 이는 정유소의 가동률을 끌어올려 상류 부문에도 파급되는 화학 제품 수요를 지원하고 있습니다.
기타 혜택
- 엑셀 형식의 시장 예측(ME) 시트
- 3개월간의 애널리스트 지원
자주 묻는 질문
목차
제1장 서론
제2장 조사 방법
제3장 개요
제4장 시장 구도
제5장 시장 규모와 성장 예측
제6장 경쟁 구도
제7장 시장 기회와 향후 전망
KSA 26.08.25According to Mordor Intelligence, China oil and gas market size in 2026 is estimated at USD 114.21 billion, growing from 2025 value of USD 108.62 billion with 2031 projections showing USD 146.75 billion, growing at 5.15% CAGR over 2026-2031.
This report is Segmented by Sector (Upstream, Midstream, and Downstream), Location (Onshore and Offshore), and Service (Construction, Maintenance and Turn-Around, and Decommissioning). The Market Sizes and Forecasts are Provided in Terms of Value (USD).
China Oil And Gas Market Trends and Insights
Energy-security Push & Import-Substitution Mandates
Beijing requires crude oil output to remain above 200 million tons per year, thereby reducing reliance on imports, which currently account for 73% of demand. CNPC and Sinopec secure low-cost policy-bank financing for infill drilling, while CNOOC accelerates offshore exploration to diversify reserves. A larger strategic petroleum reserve insulates domestic supply, and mandated local-content rules spur procurement of Chinese-made rigs, pumps, and subsea umbilicals. Petrochemical producers increase off-take contracts for domestic naphtha and ethane, locking in baseline consumption even as gasoline sales flatten. Together, these policies underpin a security premium that cushions the Chinese oil and gas market against price shocks.
Petrochemical Feedstock Demand from Dual-Circulation Strategy
China's economic planners channel investment into integrated refinery-chemical complexes that convert more barrels of crude oil into aromatics and olefins, thereby boosting hydrocarbon demand beyond transport fuels. CNOOC's Daxie Island revamp lifts crude-run capacity 50% and doubles chemical yield, mirroring upgrades in Guangdong and Jiangsu. Domestic ethylene output climbed 12% in 2024, absorbing extra condensate and LPG flows from inland basins. Petrochemical feedstock contracts typically have five-year tenures, providing producers with predictable cash flow and anchoring the Chinese oil and gas market during shifts in the energy transition.
Windfall-Profit Tax on Upstream Majors
A tiered levy skims exceptional earnings during high-price cycles, trimming reinvestment budgets at CNPC, Sinopec, and CNOOC. Management prioritises core blocks with quick payback and delays marginal frontier wells. The tax coincides with rising CCS outlays, intensifying cash-flow pressure, and slightly tempering expansion inside the Chinese oil and gas market.
Other drivers and restraints analyzed in the detailed report include:
- Shale-Gas Commercialisation in Sichuan & Chongqing
- National Pipeline Network (PipeChina) Capacity Expansion
- Stringent Methane-Emission Regulations (2025 Action Plan)
For complete list of drivers and restraints, kindly check the Table Of Contents.
Segment Analysis
Upstream activities accounted for 70.88% of China's oil and gas market share in 2025, underpinned by aggressive state-funded exploration in the Bohai, South China Sea, and Ordos regions. Meanwhile, the downstream sector is projected to drive market growth with a CAGR of 5.44% through 2031. Integrated majors utilize AI-assisted seismic inversion, reducing exploration cycle times by 20% and reinforcing their upstream preeminence.
Upstream spend focuses on reservoir management tools that enhance recovery factors in mature blocks. Carbon-capture pilots in producing wells store CO2 in depleted formations, allowing incremental barrels under stricter emission norms. Although downstream gasoline cracks narrow with EV adoption, aromatics margins remain firm, propelling refinery utilization and sustaining chemical demand that ripples upstream.
Complete Report Scope:
- By Sector
- Upstream
- Midstream
- Downstream
- By Location
- Onshore
- Offshore
- By Service
- Construction
- Maintenance and Turn-around
- Decommissioning
List of Companies Covered in this Report:
- China National Petroleum Corporation (CNPC)
- China Petroleum & Chemical Corporation (Sinopec)
- China National Offshore Oil Corporation (CNOOC)
- PipeChina (China Oil & Gas Pipeline Network Corp)
- Sinochem Holdings
- Shaanxi Yanchang Petroleum Group
- Yanchang Petroleum International Ltd
- PetroChina Company Ltd
- China Gas Holdings
- ENN Energy Holdings
- China Resources Gas
- ExxonMobil Corp
- Chevron Corp
- BP plc
- Shell plc
- TotalEnergies SE
- QatarEnergy
- Rosneft PJSC
- Gazprom PJSC
- Equinor ASA
Additional Benefits:
- The market estimate (ME) sheet in Excel format
- 3 months of analyst support
TABLE OF CONTENTS
1 Introduction
- 1.1 Study Assumptions & Market Definition
- 1.2 Scope of the Study
2 Research Methodology
3 Executive Summary
4 Market Landscape
- 4.1 Market Overview
- 4.2 Market Dynamics
- 4.2.1 Drivers
- 4.2.1.1 Energy-security push & import-substitution mandates
- 4.2.1.2 Petrochemical feedstock demand from dual-circulation strategy
- 4.2.1.3 Shale-gas commercialisation in Sichuan & Chongqing
- 4.2.1.4 National pipeline network (PipeChina) capacity expansion
- 4.2.1.5 CCS-ready refinery upgrades (Net-zero 2060 compliance)
- 4.2.1.6 AI-optimised E&P to lower lifting costs in mature basins
- 4.2.2 Restraints
- 4.2.2.1 Windfall-profit tax on upstream majors
- 4.2.2.2 Stringent methane-emission regulations (2025 action plan)
- 4.2.2.3 Accelerated electrification of road transport
- 4.2.2.4 Water-stress limits on fracking in Tarim & Ordos
- 4.2.1 Drivers
- 4.3 Supply-Chain Analysis
- 4.4 Regulatory Landscape
- 4.5 Technological Outlook
- 4.6 Crude-Oil Production & Consumption Outlook
- 4.7 Natural-Gas Production & Consumption Outlook
- 4.8 Installed Pipeline Capacity Analysis
- 4.9 Unconventional Resources CAPEX Outlook (tight oil, oil sands, deep-water)
- 4.10 Porter's Five Forces
- 4.10.1 Threat of New Entrants
- 4.10.2 Bargaining Power of Suppliers
- 4.10.3 Bargaining Power of Buyers
- 4.10.4 Threat of Substitutes
- 4.10.5 Competitive Rivalry
- 4.11 PESTLE Analysis
5 Market Size & Growth Forecasts
- 5.1 By Sector
- 5.1.1 Upstream
- 5.1.2 Midstream
- 5.1.3 Downstream
- 5.2 By Location
- 5.2.1 Onshore
- 5.2.2 Offshore
- 5.3 By Service
- 5.3.1 Construction
- 5.3.2 Maintenance and Turn-around
- 5.3.3 Decommissioning
6 Competitive Landscape
- 6.1 Market Concentration
- 6.2 Strategic Moves (M&A, Partnerships, PPAs)
- 6.3 Market Share Analysis (Market Rank/Share for key companies)
- 6.4 Company Profiles (includes Global level Overview, Market level overview, Core Segments, Financials as available, Strategic Information, Products & Services, and Recent Developments)
- 6.4.1 China National Petroleum Corporation (CNPC)
- 6.4.2 China Petroleum & Chemical Corporation (Sinopec)
- 6.4.3 China National Offshore Oil Corporation (CNOOC)
- 6.4.4 PipeChina (China Oil & Gas Pipeline Network Corp)
- 6.4.5 Sinochem Holdings
- 6.4.6 Shaanxi Yanchang Petroleum Group
- 6.4.7 Yanchang Petroleum International Ltd
- 6.4.8 PetroChina Company Ltd
- 6.4.9 China Gas Holdings
- 6.4.10 ENN Energy Holdings
- 6.4.11 China Resources Gas
- 6.4.12 ExxonMobil Corp
- 6.4.13 Chevron Corp
- 6.4.14 BP plc
- 6.4.15 Shell plc
- 6.4.16 TotalEnergies SE
- 6.4.17 QatarEnergy
- 6.4.18 Rosneft PJSC
- 6.4.19 Gazprom PJSC
- 6.4.20 Equinor ASA
7 Market Opportunities & Future Outlook
- 7.1 White-space & Unmet-Need Assessment