
|
시장보고서
상품코드
2120409
인도네시아의 석유 및 가스 : 시장 점유율 분석, 업계 동향 및 통계, 성장 예측(2026-2031년)Indonesia Oil And Gas - Market Share Analysis, Industry Trends & Statistics, Growth Forecasts (2026 - 2031) |
||||||
 Mordor Intelligence
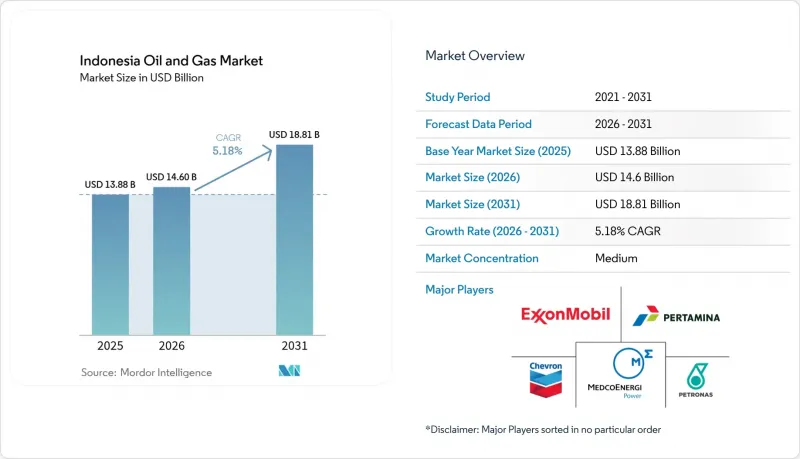
Mordor Intelligence에 의하면, 인도네시아의 석유 및 가스 시장 규모는 2025년 138억 8,000만 달러로 평가되었습니다. 2026년에는 146억 달러로 확대되어 2026년부터 2031년에 걸쳐 CAGR 5.18%로 성장을 지속하여, 2031년에는 188억 1,000만 달러에 이를 것으로 예측됩니다.
본 보고서는 부문(업스트림, 중류, 하류), 지역(육상 및 해상), 서비스(건설, 유지보수·턴어라운드, 해체)별로 분류되어 있습니다. 시장 규모 및 전망은 금액(달러)으로 표시되어 있습니다.
인도네시아의 석유 및 가스 시장 동향 및 인사이트
중산층의 부상으로 인한 견조한 국내 수요
인도네시아에서 확대되고 있는 중산층이 휘발유, 디젤, 석유화학제품의 소비를 끌어올리고 있으며, 일일 원유 수요는 2025년 약 160만 배럴에서 2030년까지 180만 배럴에 달할 것으로 예측됩니다. 자바 섬의 도시화율이 60% 이상의 가운데, 연비 효율화 노력이 진행되는 한편, 운송용 연료 사용량은 증가하고 있습니다. 또한, 개인 소득 증가가 플라스틱 및 포장재에 대한 수요 증가를 뒷받침하고 있습니다. 천연가스 수요는 2030년까지 12 Bcf/d에 달할 것으로 전망됩니다. 이는 복합 사이클 발전소가 재생에너지의 간헐성을 보완하고, 산업용 보일러 수요를 충족시키기 위함입니다. 연료 보조금 개혁을 통해 절약된 자금이 도로, 항만, 대중교통 프로젝트에 재투자되고 있으며, 이는 에너지 수요를 더욱 자극하여 국내산 탄화수소에 대한 장기적인 수요를 뒷받침하고 있습니다.
2030년까지 원유 100만 배럴/일, 가스 12 Bcf/d 생산을 목표로 하는 정부의 이니셔티브
SKK Migas는 이미 정제 제품 수요의 60%를 충당하고 있는 수입 의존도를 낮추기 위해, 원유 100만 배럴/일(bbl/d), 천연가스 120억 입방피트/일(Bcf/d)의 생산을 목표로 하고 있습니다. 우선적으로 추진될 시책에는 신속 승인이 예정된 127개 광구, 증진 채유(EOR)를 위한 세제 우대 조치, 그리고 한계 저류층의 생산량을 향상시키는 디지털 유전 감시 시스템 등이 포함됩니다. 아바디 LNG 및 탕후 확장 계획과 같은 프로젝트가 가스 공급 능력을 뒷받침하는 한편, 미나스와 두리에서 진행 중인 증기 주입법 및 화학적 EOR(증진 채유) 사업이 생산량의 자연 감소를 억제하고 있습니다. 규제 측면에서는 감사 절차를 간소화하고 조기 현금 흐름을 보장하는 ‘총생산 분배 방식(Gross Split)’의 생산분배계약(PSC)이 도입되어, 이에 따라 셰브론, 하버 에너지, 메드코와 같은 기업들이 프론티어 지역 진출을 결정하고 있습니다.
재생에너지 확대와 전기차 보급
인도네시아는 2025년까지 재생에너지 보급률을 23%로 높였고, 2060년까지 순배출 제로를 달성하는 것을 목표로 하고 있습니다. 이러한 야심찬 목표에 따라 화석 연료 프로젝트에서 자본이 전환되어, 현재 건설 중인 태양광 발전, 풍력 발전, 지열 발전의 설비 용량은 총 10GW에 달할 전망입니다. 전기차 조립 공장에 대한 세제 혜택에 힘입어, 2030년까지 200만 대의 배터리식 전기차를 도로에 운행하겠다는 국가 목표에 따라 전 세계 각국의 OEM 업체들이 서자바주에 모여들고 있습니다. 가스는 여전히 발전의 불안정성을 보완하고 있지만, 유료 도로변의 충전 네트워크가 정비됨에 따라 장기적으로는 휘발유 수요가 감소하는 추세입니다. 그러나 인프라 부족과 가격에 대한 민감성으로 인해 단기적인 대체 효과는 제한적이며, 인도네시아의 석유 및 가스 시장은 운송 및 산업이라는 핵심 부문을 유지할 것으로 전망됩니다.
부문별 분석
2025년 인도네시아의 석유 및 가스 시장 규모(업스트림 부문)는 100억 1,000만 달러로, 총 수익의 72.10%를 차지했으며, 2031년까지 연평균 성장률(CAGR) 5.55%를 나타낼 것으로 예측됩니다. 주요 자본 투자로는 BP의 70억 달러 규모의 탕구(Tangguh) UCC 프로젝트와 인펙스(Inpex)의 200억 달러 규모의 아바디(Abadi) LNG 프로젝트가 있으며, 이는 장기 주기 가스 프로젝트에 대한 기업의 확고한 신뢰를 보여줍니다. 생산분배계약(PSC) 개혁, 지하 구조의 디지털 이미징, 그리고 저류층용 로봇 기술 덕분에 기존 유정의 회수율이 향상되어, 분지가 성숙 단계에 접어들더라도 업스트림 부문의 현금 흐름이 강화되고 있습니다.
총수익 분할 방식(Gross-split)의 생산분배계약(PSC)은 투명성을 높였으며, 비용의 확실성이 셰브론(Chevron)의 라팍(Lapak) 블록 복귀와 하버 에너지(Harbor Energy)의 투나(Tuna) 지역 인필 시추 계획을 뒷받침하고 있습니다. 펠타미나(Pertamina)와 FPT 소프트웨어가 도입한 디지털 자산 건전성 관리 시스템 덕분에 예기치 못한 가동 중단이 15% 감소했으며, AI 통합이 가져다주는 운영상의 이점이 입증되었습니다. 미드스트림 부문의 확장(중부 술라웨시와 자바를 연결하는 새로운 파이프라인)은 운송의 경제성을 확보하는 한편, 다운스트림 부문의 투반 정유시설에서 석유화학 통합을 통해 중질 원유를 고수익률의 올레핀으로 전환함으로써 수익 창출을 도모하고 있습니다.
기타 혜택 :
- 엑셀 형식 시장 예측(ME) 시트
- 3개월간의 애널리스트 지원
자주 묻는 질문
목차
제1장 서론
제2장 조사 방법
제3장 주요 요약
제4장 시장 구도
제5장 시장 규모 및 성장 예측
제6장 경쟁 구도
제7장 시장 기회 및 향후 전망
KTH 26.09.10According to Mordor Intelligence, the Indonesia oil and gas market size is expected to grow from USD 13.88 billion in 2025 to USD 14.6 billion in 2026 and is forecast to reach USD 18.81 billion by 2031 at 5.18% CAGR over 2026-2031.
This report is Segmented by Sector (Upstream, Midstream, and Downstream), Location (Onshore and Offshore), and Service (Construction, Maintenance and Turn-Around, and Decommissioning). The Market Sizes and Forecasts are Provided in Terms of Value (USD).
Indonesia Oil And Gas Market Trends and Insights
Robust Domestic Demand from Rising Middle Class
Indonesia's growing middle class is driving up gasoline, diesel, and petrochemical consumption, with daily crude demand projected to reach 1.8 million barrels by 2030, up from roughly 1.6 million barrels in 2025. Java's urbanization rate above 60% intensifies transport fuel use, despite efficiency drives, while rising personal incomes underpin higher demand for plastics and packaging. Natural gas demand is expected to reach 12 Bcf/d by 2030, as combined-cycle power plants supplement renewable energy intermittency and meet the needs of industrial boilers. Fuel-subsidy reforms redirect savings into roads, ports, and mass transit projects, which further spur energy needs, reinforcing the long-term pull for domestic hydrocarbons.
Government Push for 1 Million bbl/d Crude and 12 Bcf/d Gas by 2030
SKK Migas targets 1 million barrels per day (bbl/d) of oil and 12 billion cubic feet per day (Bcf/d) of gas to curb import dependence, which already covers 60% of refined-product demand. Priority accelerators include 127 blocks slated for fast-track approval, fiscal sweeteners for enhanced recovery, and digital field surveillance that lifts output from marginal reservoirs. Projects such as Abadi LNG and the Tangguh expansion underpin gas deliverability, whereas steamflood and chemical EOR initiatives at Minas and Duri slow base decline. The regulatory path features gross-split PSCs that streamline audits and guarantee earlier cash flow, attracting Chevron, Harbour Energy, and Medco into frontier acreage.
Renewable-Energy Build-Out and EV Adoption
Indonesia aims for 23% renewable energy penetration by 2025 and net-zero emissions by 2060, ambitions that redirect capital from fossil fuel projects into solar, wind, and geothermal units totaling 10 GW under construction. Fiscal incentives for EV assembly plants draw global OEMs to West Java, in line with a national goal of 2 million battery electric vehicles on the roads by 2030. While gas still balances intermittency, long-run gasoline demand faces attrition as charging networks densify across toll-road corridors. Yet infrastructure gaps and price sensitivity moderate short-term displacement, allowing the Indonesian oil and gas market to retain core transport and industrial segments.
Other drivers and restraints analyzed in the detailed report include:
- LNG Export Arbitrage to North-East Asia
- PSC Gross-Split Incentives Attracting IOCs
- Declining Output from Ageing Basins
For complete list of drivers and restraints, kindly check the Table Of Contents.
Segment Analysis
Indonesia's oil and gas market size for the upstream segment was USD 10.01 billion in 2025, accounting for 72.10% of the overall revenue and projected to grow at a 5.55% CAGR through 2031. Major capital commitments include BP's USD 7 billion Tangguh UCC and Inpex's USD 20 billion Abadi LNG project, signaling durable corporate confidence in long-cycle gas projects. Production-sharing reforms, digital subsurface imaging, and reservoir robotics enhance recovery rates from legacy wells, reinforcing upstream cash flow even as basins mature.
Gross-split PSCs heighten transparency, with cost certainty spurring Chevron's return to the Rapak Block and Harbour Energy's infill campaign at Tuna. Digital asset integrity systems deployed by Pertamina and FPT Software reduced unplanned shutdowns by 15%, demonstrating the operational advantage that AI integration provides. Midstream expansions-new pipelines linking Central Sulawesi to Java-protect evacuation economics, while downstream petrochemical integration at Tuban refinery monetizes heavier crudes into high-margin olefins.
Complete Report Scope:
- By Sector
- Upstream
- Midstream
- Downstream
- By Location
- Onshore
- Offshore
- By Service
- Construction
- Maintenance and Turn-around
- Decommissioning
List of Companies Covered in this Report:
- Pertamina
- Chevron
- ExxonMobil
- Shell
- BP
- Petronas
- ConocoPhillips
- Medco Energi
- Eni
- TotalEnergies
- Repsol
- Sinopec
- PGN
- Chandra Asri
- Inpex
- Mubadala Energy
- Harbour Energy
- Conrad Asia Energy
- PT Connusa Energindo
- CNOOC
Additional Benefits:
- The market estimate (ME) sheet in Excel format
- 3 months of analyst support
TABLE OF CONTENTS
1 Introduction
- 1.1 Study Assumptions & Market Definition
- 1.2 Scope of the Study
2 Research Methodology
3 Executive Summary
4 Market Landscape
- 4.1 Market Overview
- 4.2 Market Drivers
- 4.2.1 Robust domestic demand from rising middle class
- 4.2.2 Government push for 1 mb/d crude & 12 Bcf/d gas by 2030
- 4.2.3 LNG export arbitrage to North-East Asia
- 4.2.4 PSC gross-split incentives attracting IOCs
- 4.2.5 Carbon-capture hubs boosting mature-field economics
- 4.2.6 AI-enabled digital oilfields cutting lifting cost
- 4.3 Market Restraints
- 4.3.1 Renewable-energy build-out & EV adoption
- 4.3.2 Declining output from ageing basins
- 4.3.3 Land-right & indigenous community disputes
- 4.3.4 ESG-linked financing constraints
- 4.4 Supply-Chain Analysis
- 4.5 Regulatory Landscape
- 4.6 Technological Outlook
- 4.7 Crude-Oil Production & Consumption Outlook
- 4.8 Natural-Gas Production & Consumption Outlook
- 4.9 Installed Pipeline Capacity Analysis
- 4.10 Unconventional Resources CAPEX Outlook (tight oil, oil sands, deep-water)
- 4.11 LNG Terminal Capacity Outlook
- 4.12 Porter's Five Forces
- 4.12.1 Threat of New Entrants
- 4.12.2 Bargaining Power of Suppliers
- 4.12.3 Bargaining Power of Buyers
- 4.12.4 Threat of Substitutes
- 4.12.5 Competitive Rivalry
- 4.13 PESTLE Analysis
5 Market Size & Growth Forecasts
- 5.1 By Sector
- 5.1.1 Upstream
- 5.1.2 Midstream
- 5.1.3 Downstream
- 5.2 By Location
- 5.2.1 Onshore
- 5.2.2 Offshore
- 5.3 By Service
- 5.3.1 Construction
- 5.3.2 Maintenance and Turn-around
- 5.3.3 Decommissioning
6 Competitive Landscape
- 6.1 Market Concentration
- 6.2 Strategic Moves (M&A, Partnerships, PPAs)
- 6.3 Market Share Analysis (Market Rank/Share for key companies)
- 6.4 Company Profiles (includes Global level Overview, Market level overview, Core Segments, Financials as available, Strategic Information, Products & Services, and Recent Developments)
- 6.4.1 Pertamina
- 6.4.2 Chevron
- 6.4.3 ExxonMobil
- 6.4.4 Shell
- 6.4.5 BP
- 6.4.6 Petronas
- 6.4.7 ConocoPhillips
- 6.4.8 Medco Energi
- 6.4.9 Eni
- 6.4.10 TotalEnergies
- 6.4.11 Repsol
- 6.4.12 Sinopec
- 6.4.13 PGN
- 6.4.14 Chandra Asri
- 6.4.15 Inpex
- 6.4.16 Mubadala Energy
- 6.4.17 Harbour Energy
- 6.4.18 Conrad Asia Energy
- 6.4.19 PT Connusa Energindo
- 6.4.20 CNOOC
7 Market Opportunities & Future Outlook
- 7.1 White-space & Unmet-need Assessment