
|
시장보고서
상품코드
2121392
영국의 석유 및 가스 : 시장 점유율 분석, 업계 동향·통계, 성장 예측(2026-2031년)United Kingdom Oil And Gas - Market Share Analysis, Industry Trends & Statistics, Growth Forecasts (2026 - 2031) |
||||||
 Mordor Intelligence
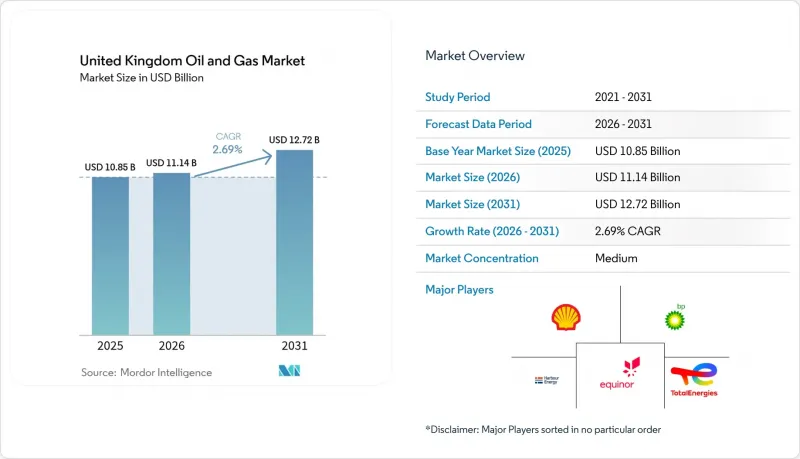
Mordor Intelligence에 따르면 영국의 석유 및 가스 시장 규모는 2025년 108억 5,000만 달러에서 2026년에는 111억 4,000만 달러로 확대하며, 2026-2031년에 CAGR 2.69%로 추이하며, 2031년에는 127억 2,000만 달러에 달할 것으로 예측됩니다.
이 보고서는 부문(업스트림, 미드스트림, 다운스트림), 운영 지역(온쇼어·오프쇼어), 서비스(건설, 유지보수·턴어라운드, 해체)별로 분류되어 있습니다. 시장 규모 및 전망은 금액(달러)으로 표시되어 있습니다.
영국 석유 및 가스 시장의 동향 및 인사이트
북해의 채굴 비용 감소가 운영 효율을 향상
북해의 채굴 비용은 대폭 하락하고 있으며, 세계 에너지 시장이 해결해야 할 과제에 직면한 가운데 영국 운영사들에게 경쟁 우위를 제공하고 있습니다. 해저 시스템의 기술적 진보와 시추 기술의 향상으로 인해 2020년 이후 배럴당 채굴 비용은 15-20% 절감되어, 재정적 압박이 가중되는 상황에서도 생산의 수익성이 유지되고 있습니다. 이러한 비용 절감 추세는 특히 에너지 안보에 대한 우려가 커지고 국내 생산의 가치가 중시되는 가운데, 영국의 유전들을 국제적인 대안들에 비해 유리한 위치에 놓이게 하고 있습니다. 이러한 효율화는 회수율을 극대화하면서 운영 비용을 최소화하는 첨단 저류층 관리 시스템과 최적화된 생산 스케줄링을 통해 이루어지고 있습니다. 운영사는 이러한 비용 개선을 활용하여 유전 수명을 연장하고, 그렇지 않았다면 조기 폐쇄 조치에 직면했을 수도 있는 성숙한 자산에 대한 지속적인 투자를 정당화하고 있습니다.
영국 북해 ‘전환 협정’의 인센티브가 투자 우선순위를 재편
영국 북해 전환 협정은 탄소 중립 목표를 향해 측정 가능한 진전을 보이는 사업자에게 체계적인 재정적 인센티브를 제공함으로써, 업계 전반의 자본 배분 결정을 근본적으로 변화시키고 있습니다. 투자 공제 및 감가상각률 인상은 탄소 포집·활용·저장(CCUS) 기술을 사업에 통합하는 기업에 보상을 제공하는 것으로, 요건을 충족하는 프로젝트에는 해당 지출의 최대 40%에 해당하는 세액 공제가 조기에 적용됩니다. 이 정책 프레임워크를 통해 2024년 이후 20억 파운드가 넘는 CCUS 투자가 확보되었으며, 이전에는 경제성이 없었던 프로젝트들이 실현 가능한 개발 기회로 변모하고 있습니다. 이 협정은 배출 감축 분야에서 기술적 리더십을 발휘하는 사업자에게 경쟁 우위를 부여하며, 저탄소 탄화수소 생산으로의 전환을 사실상 지원합니다. 이러한 우대 조치를 받기 위해서는 ISO 14001 환경경영 인증 취득이 점점 더 중요해지고 있으며, 사업자들은 규정 준수 체제 구축에 막대한 투자를 하고 있습니다.
CCS 과세 가속화로 사업자의 현금 흐름 압박
상류 사업자를 대상으로 한 탄소 포집 및 저장(CCS) 과세 가속화가 도입됨에 따라 영국 대륙붕 전역에 즉각적인 재정적 압박이 발생하고 있으며, 주요 생산자의 규정 준수 비용은 연간 1억 5,000만-2억 파운드로 추정됩니다. 이 규제 체계에서는 개별 프로젝트 참여 여부와 관계없이 사업자가 국가의 CCS 인프라 개발에 기여할 것을 요구하고 있으며, 사실상 부문별 과세를 통해 보다 광범위한 에너지 전환 목표를 지원하는 형태를 띠고 있습니다. 이러한 과세 구조는 이러한 추가 비용을 감당할 규모가 없는 중소규모의 독립 사업자에게 불균형적인 영향을 미치고 있으며, 수익성을 확보하지 못하는 사업자가 더 큰 규모의 파트너를 모색하거나 시장에서 완전히 철수함에 따라 업계 재편이 가속화될 가능성이 있습니다. 과세 요건을 준수하기 위해서는 감시 및 보고 역량을 강화해야 하며, 이로 인해 업무의 복잡성이 증가하고 자원 부담이 더욱 커지고 있습니다.
부문 분석
2025년에 상류 부문이 71.65%라는 압도적인 시장 점유율을 차지하고 있는 것은 영국의 석유 및 가스 사업에서 채굴 활동이 여전히 중심적인 위치를 차지하고 있음을 반영하지만, 2031년까지 미드스트림 부문의 연평균 성장률(CAGR)이 4.18%에 달한다는 점은 인프라 및 처리 시설에 대한 투자로 근본적인 전환이 이루어지고 있음을 시사합니다. 상류 활동은 기존 북해 자산에서 가치를 극대화하는 증산 기술과 유전 수명 연장 프로그램의 혜택을 받고 있습니다. 하버 에너지(Harbour Energy)와 같은 사업자들은 생산 능력을 강화하기 위해 2024년에 13억 달러 이상을 자산 인수에 투자했습니다. 미드스트림 부문의 성장 가속화는 이산화탄소 포집·활용·저장(CCUS) 프로젝트에 필요한 핵심 인프라 요건에 기인하며, CO₂ 수송 및 수소 생산에 대응하기 위해 파이프라인망과 처리 시설에 대한 대대적인 업그레이드가 요구되고 있습니다. 다운스트림 사업은 정제 제품에 대한 수요로 인해 견실한 실적을 유지하고 있지만, 이 부문은 전기화 추세와 재생 가능 연료 의무화로 인해 장기적인 역풍에 직면해 있습니다.
미드스트림 인프라에 대한 투자는 특히 동부 해안 클러스터에 집중되어 있으며, 케라스 미드스트림(Keras Midstream)사의 ‘H2NorthEast’ 시설은 1기가와트의 블루 수소 생산 능력을 갖추고 있으나, 이를 위해서는 대규모 파이프라인 개보수 및 새로운 압축 스테이션 설치가 필요합니다. 영국 석유 및 가스 시장의 미드스트림 사업 규모는 2025년에 21억 9,000만 달러에 달했으며, 연간 성장률은 업계 평균보다 1.5%포인트 높았습니다. 영국의 가스 수송 시스템은 7,600km 이상에 달하는 고압 파이프라인으로 구성되어 있으며, 내셔널 그리드(National Grid)는 기존 가스 수송과 신흥 수소 용도 모두를 지원하는 네트워크 유지 및 강화 프로젝트에 연간 25억 파운드를 투자하고 있습니다. 부유식 생산·저장·하역선(FPSO)의 도입으로 처리 능력이 확대되어, 이를 통해 그동안 개발이 어려웠던 매장량의 개발이 가능해졌습니다. 한편, 저장 인프라는 전략적 석유 비축 요건과 계절적 수요 평준화 필요성으로부터 혜택을 받고 있습니다.
기타 혜택:
- 엑셀 형식의 시장 예측(ME) 시트
- 3개월간 애널리스트 지원
자주 묻는 질문
목차
제1장 서론
제2장 조사 방법
제3장 개요
제4장 시장 구도
제5장 시장 규모와 성장 예측
제6장 경쟁 구도
제7장 시장 기회와 향후 전망
KSA 26.09.04According to Mordor Intelligence, the United Kingdom oil and gas market size is expected to grow from USD 10.85 billion in 2025 to USD 11.14 billion in 2026 and is forecast to reach USD 12.72 billion by 2031 at 2.69% CAGR over 2026-2031.
This report is Segmented by Sector (Upstream, Downstream, and Midstream), Location (Onshore and Offshore), and Service (Construction, Maintenance and Turn-Around, and Decommissioning). The Market Sizes and Forecasts are Provided in Terms of Value (USD).
United Kingdom Oil And Gas Market Trends and Insights
Declining North Sea Lifting Costs Drive Operational Efficiency
North Sea lifting costs have decreased substantially, creating competitive advantages for UK operators amid global energy market challenges. Technological breakthroughs in subsea systems and enhanced drilling techniques have cut per-barrel extraction costs by 15-20% since 2020, sustaining production viability despite heightened fiscal pressures. This cost reduction trajectory positions UK fields favorably against international alternatives, particularly as energy security concerns elevate domestic production value. The efficiency gains result from advanced reservoir management systems and optimized production scheduling, which maximize recovery rates while minimizing operational expenses. Operators leverage these cost improvements to extend field life and justify continued investment in mature assets that might otherwise face early decommissioning.
UK North Sea Transition Deal Incentives Reshape Investment Priorities
The UK North Sea Transition Deal offers structured fiscal incentives to operators demonstrating measurable progress toward net-zero emissions targets, thereby fundamentally altering capital allocation decisions across the sector. Investment allowances and enhanced depletion rates reward companies that integrate carbon capture, utilization, and storage technologies into their operations, with qualifying projects receiving accelerated tax relief worth up to 40% of eligible expenditures. This policy framework has catalyzed over £2 billion in committed CCUS investments since 2024, transforming previously uneconomical projects into viable development opportunities. The deal creates competitive advantages for operators demonstrating technological leadership in emissions reduction, effectively subsidizing the transition toward lower-carbon hydrocarbon production. ISO 14001 environmental management certification has become increasingly critical for accessing these incentives, with operators investing heavily in compliance processes.
Accelerated CCS Levy Strains Operator Cash Flows
The introduction of accelerated carbon capture and storage levies on upstream operators has created immediate financial pressure across the UK Continental Shelf, with compliance costs estimated at £150-200 million annually for major producers. This regulatory framework requires operators to contribute to national CCS infrastructure development regardless of their individual project participation, effectively subsidizing broader energy transition objectives through sector-specific taxation. The levy structure disproportionately impacts smaller independents who lack the scale to absorb these additional costs, potentially accelerating consolidation as marginal operators seek larger partners or exit the market entirely. Compliance with the levy requirements demands enhanced monitoring and reporting capabilities, which add operational complexity and further strain resources.
Other drivers and restraints analyzed in the detailed report include:
- Floating Wind Platform Integration Reduces Operational Carbon Intensity
- Teesside and Humber Industrial Clusters Create Blue Hydrogen Demand
- Offshore Wind Grid Integration Reduces Peak Gas Demand
For complete list of drivers and restraints, kindly check the Table Of Contents.
Segment Analysis
The upstream segment's commanding 71.65% market share in 2025 reflects the continued centrality of extraction activities to UK oil and gas operations, yet the midstream segment's 4.18% CAGR through 2031 signals a fundamental shift toward infrastructure and processing investments. Upstream activities benefit from enhanced recovery techniques and extended field life programs that maximize value from existing North Sea assets. Operators like Harbour Energy have invested over USD 1.3 billion in asset acquisitions during 2024 to consolidate production capabilities. The midstream segment's accelerated growth stems from critical infrastructure requirements for carbon capture, utilization, and storage projects, with pipeline networks and processing facilities requiring substantial upgrades to handle CO2 transport and hydrogen production. Downstream operations maintain steady performance through refined product demand, though the segment faces long-term headwinds from electrification trends and renewable fuel mandates.
Midstream infrastructure investments are particularly concentrated in the East Coast Cluster, where Kellas Midstream's H2NorthEast facility represents a 1 GW blue hydrogen production capability that necessitates extensive pipeline modifications and the installation of new compression stations. The UK oil and gas market size for midstream operations reached USD 2.19 billion in 2025, with annual growth rates exceeding the sector average by 1.5 percentage points. The UK's gas transmission system spans over 7,600 km of high-pressure pipelines, with National Grid investing £2.5 billion annually in network maintenance and enhancement projects that support both traditional gas transport and emerging hydrogen applications. Processing capabilities are expanding through the deployment of floating production, storage, and offloading vessels, which enable the development of previously stranded reserves. Meanwhile, storage infrastructure benefits from strategic petroleum reserve requirements and seasonal demand balancing needs.
Complete Report Scope:
- By Sector
- Upstream
- Midstream
- Downstream
- By Location of Deployment
- Onshore
- Offshore
- By Service
- Construction
- Maintenance and Turn-around
- Decommissioning
List of Companies Covered in this Report:
- Shell plc
- BP plc
- Harbour Energy plc
- TotalEnergies SE
- Equinor ASA
- Chevron Corp.
- Centrica plc
- Valaris plc
- INEOS Group Ltd
- ConocoPhillips UK Ltd
- EnQuest plc
- Ithaca Energy plc
- Neptune Energy Group
- Cadent Gas Ltd
- Dana Petroleum Ltd
- ESSO UK Ltd
- BG Group Ltd
- Premier Oil (Chrysaor)
- Wood plc
- Subsea 7 SA
Additional Benefits:
- The market estimate (ME) sheet in Excel format
- 3 months of analyst support
TABLE OF CONTENTS
1 Introduction
- 1.1 Study Assumptions & Market Definition
- 1.2 Scope of the Study
2 Research Methodology
3 Executive Summary
4 Market Landscape
- 4.1 Market Overview
- 4.2 Market Drivers
- 4.2.1 Declining North Sea lifting costs
- 4.2.2 UK "North Sea Transition Deal" incentives
- 4.2.3 Surge in floating-wind-powered platforms (E&P cost cuts)
- 4.2.4 Re-industrialisation of Teesside & Humber (blue hydrogen demand)
- 4.2.5 AI-enabled seismic imaging success rates
- 4.3 Market Restraints
- 4.3.1 Accelerated CCS levy on upstream operators
- 4.3.2 Grid-connected offshore wind cannibalising peak-time gas demand
- 4.3.3 Heightened decommissioning bond requirements
- 4.4 Supply-Chain Analysis
- 4.5 Regulatory Landscape
- 4.6 Technological Outlook
- 4.7 Crude-Oil Production & Consumption Outlook
- 4.8 Natural-Gas Production & Consumption Outlook
- 4.9 Installed Pipeline Capacity Analysis
- 4.10 Unconventional Resources CAPEX Outlook (tight oil, oil sands, deep-water)
- 4.11 Porter's Five Forces
- 4.11.1 Bargaining Power of Suppliers
- 4.11.2 Bargaining Power of Consumers
- 4.11.3 Threat of New Entrants
- 4.11.4 Threat of Substitutes
- 4.11.5 Intensity of Competitive Rivalry
- 4.12 PESTLE Analysis
5 Market Size & Growth Forecasts
- 5.1 By Sector
- 5.1.1 Upstream
- 5.1.2 Midstream
- 5.1.3 Downstream
- 5.2 By Location of Deployment
- 5.2.1 Onshore
- 5.2.2 Offshore
- 5.3 By Service
- 5.3.1 Construction
- 5.3.2 Maintenance and Turn-around
- 5.3.3 Decommissioning
6 Competitive Landscape
- 6.1 Market Concentration
- 6.2 Strategic Moves (M&A, Partnerships, PPAs)
- 6.3 Market Share Analysis (Market Rank/Share for key companies)
- 6.4 Company Profiles (includes Global level Overview, Market level overview, Core Segments, Financials as available, Strategic Information, Products & Services, and Recent Developments)
- 6.4.1 Shell plc
- 6.4.2 BP plc
- 6.4.3 Harbour Energy plc
- 6.4.4 TotalEnergies SE
- 6.4.5 Equinor ASA
- 6.4.6 Chevron Corp.
- 6.4.7 Centrica plc
- 6.4.8 Valaris plc
- 6.4.9 INEOS Group Ltd
- 6.4.10 ConocoPhillips UK Ltd
- 6.4.11 EnQuest plc
- 6.4.12 Ithaca Energy plc
- 6.4.13 Neptune Energy Group
- 6.4.14 Cadent Gas Ltd
- 6.4.15 Dana Petroleum Ltd
- 6.4.16 ESSO UK Ltd
- 6.4.17 BG Group Ltd
- 6.4.18 Premier Oil (Chrysaor)
- 6.4.19 Wood plc
- 6.4.20 Subsea 7 SA
7 Market Opportunities & Future Outlook
- 7.1 White-space & Unmet-Need Assessment