
|
시장보고서
상품코드
2120284
미국의 석유 및 가스 : 시장 점유율 분석, 업계 동향과 통계, 성장 예측(2026-2031년)United States Oil And Gas - Market Share Analysis, Industry Trends & Statistics, Growth Forecasts (2026 - 2031) |
||||||
 Mordor Intelligence
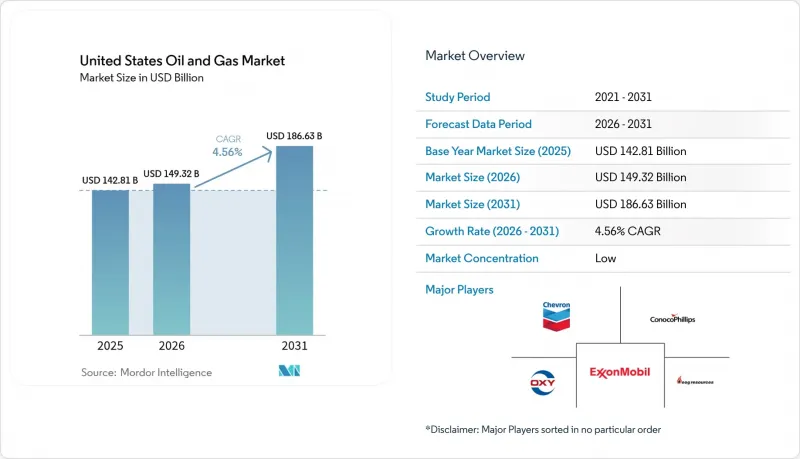
Mordor Intelligence에 따르면 2026년 미국의 석유 및 가스 시장 규모는 1,493억 2,000만 달러로 추정되고 있으며, 2025년 1,428억 1,000만 달러에서 확대하며, 2031년의 예측치는 1,866억 3,000만 달러에 달하며, 2026-2031년에 CAGR 4.56%로 성장할 것으로 전망되고 있습니다.
이 보고서는 부문(상류, 중류, 하류), 지역(육상 및 해상), 서비스(건설, 유지보수·턴어라운드, 해체)별로 분류되어 있습니다. 시장 규모 및 전망은 금액()으로 표시되어 있습니다.
미국 석유 및 가스 시장의 동향 및 인사이트
퍼미안 분지의 타이트 오일 생산성 향상
첨단 완공 설계와 AI를 활용한 시추 덕분에 2024년 퍼미안 분지의 생산량은 하루 630만 배럴에 달했습니다. 이는 시추 장비 수가 감소했음에도 불구하고 미국 전체 성장량의 60%를 차지하고 있습니다. 더 긴 수평 유정, 프로판 충전량 증가, 실시간 프래킹 최적화를 통해 유정당 회수량이 향상되는 동시에 비용 절감도 도모되고 있습니다. 엑슨모빌의 파이오니어사 인수는 표준화된 운영과 인프라 공유를 통해 생산량을 추가로 15% 증가시키는 것을 목표로 하고 있습니다. 독립 시추 업체들도 경쟁력을 유지하기 위해 유사한 전략을 채택하고 있습니다. 따라서 효율성 향상은 생산량의 지속적인 증가를 지원하는 기반이 되고 있으며, 가격 변동에 대한 미국 석유 및 가스 시장의 회복력을 높이고 있습니다.
급증하는 LNG 수출 능력
멕시코만 연안의 새로운 액화 플랜트는 국내 공급을 세계 시장의 가격 프리미엄과 연계함으로써 수요 구조를 재편하고 있습니다. 벤처 글로벌(Venture Global)의 프락민스(Prachminz) 터미널은 2024년에 연간 2,000만 톤의 처리 능력을 추가할 예정이며, 이어 골든 패스(Golden Pass)가 연간 1,560만 톤의 처리 능력으로 가동을 시작할 예정입니다. 수출의 급증은 애팔래치아 및 헤인즈빌 지역의 시추를 촉진하는 한편, 총 150억 달러 규모의 신규 파이프라인이 생산량을 남부 지역으로 수송하고 있습니다. 세계 시장과의 연동성이 높아짐에 따라 헨리 허브의 계절적 가격 변동이 완화되고, 생산자 및 미드스트림 사업자의 미래 전망이 명확해지면서 미국 석유 및 가스 시장의 확장이 더욱 가속화되고 있습니다.
EPA의 OOOOb/c에 기반한 메탄 배출 규제 준수 비용
2024년 이후, 설정된 기준치를 초과하는 메탄 배출량에 대해서는 1미터톤당 900달러부터 시작하는 과징금이 부과되며, 2026년까지 1,500달러로 인상됩니다. 감시 및 복구 프로그램의 추가로 인해 일반적인 셰일 유정의 운영 비용은 배럴당 2-4달러 증가하여, 소규모 생산자들에게 가장 큰 타격을 줄 것입니다. 규정 준수 요건으로 인해 업계 재편이 가속화되고, 연속 누출 감지 등의 기술이 신속히 도입되어야 하므로, 미국 석유 및 가스 시장의 비용 구조가 변화하게 될 것입니다.
부문별 분석
2025년 현재, 상류 부문은 미국 석유 및 가스 시장 규모의 71.85%를 차지하고 있으며, 2031년까지 연평균 성장률(CAGR) 4.84%를 기록할 전망입니다. 중류 부문은 파이프라인 증설 및 LNG 터미널 확장에 힘입어 18.40%를 차지했습니다. 반면, 하류 부문의 정제 사업은 생산 능력 제약과 배출 규제 강화로 인해 9.75%에 그쳤습니다. 현재 각 사업자는 원유 가격 60달러 시점에 내부수익률(IRR) 15% 이상을 목표로 하고 있으며, 자본을 수익성이 높은 셰일 횡갱이나 엄선된 장기 주기 프로젝트에 투입하고 있습니다. 코노코필립스의 윌로우 개발은 이러한 변화를 상징하는 사례로, 30년 분의 매장량을 바탕으로 단기 사이클 셰일 프로젝트에서는 드문 현금 흐름의 지속성을 확보하고 있습니다. 시추 효율 향상과 체계적인 재투자를 통해 상류 부문은 미국 석유 및 가스 시장의 지속적인 성장 중심에 계속 자리 잡고 있습니다.
상류 부문의 우위는 배럴당 40달러 미만의 손익분기점 부근으로 비용을 유지하는 급속한 생산성 향상에 힘입고 있습니다. 중류 부문은 LNG의 성장이 저장 및 운송 수요를 견인하고 있으며, 여전히 기회가 풍부한 부문이지만, 자본 운용에 있으며, 규율이 투기적인 프로젝트를 억제하고 있습니다. 하류 부문의 이익률은 재생 가능 디젤과의 경쟁 및 규제 대응에 따른 비용으로 인해 축소되는 추세에 있습니다. 이러한 동향들이 복합적으로 작용하여, 미국 석유 및 가스 시장의 수익 동향에 대해 상류 부문이 지대한 영향력을 행사하고 있음을 지원하고 있습니다.
기타 혜택:
- 엑셀 형식의 시장 예측(ME) 시트
- 3개월간의 애널리스트 지원
자주 묻는 질문
목차
제1장 서론
제2장 조사 방법
제3장 개요
제4장 시장 구도
제5장 시장 규모와 성장 예측
제6장 경쟁 구도
제7장 시장 기회와 향후 전망
KSA 26.09.02According to Mordor Intelligence, the United States oil and gas market size in 2026 is estimated at USD 149.32 billion, growing from 2025 value of USD 142.81 billion with 2031 projections showing USD 186.63 billion, growing at 4.56% CAGR over 2026-2031.
This report is Segmented by Sector (Upstream, Midstream, and Downstream), Location (Onshore and Offshore), and Service (Construction, Maintenance and Turn-Around, and Decommissioning). The Market Sizes and Forecasts are Provided in Terms of Value (USD).
United States Oil And Gas Market Trends and Insights
Tight-oil Productivity Gains in the Permian
Advanced completion designs and AI-guided drilling lifted Permian Basin output to 6.3 million barrels per day in 2024, representing 60% of total US growth despite a leaner rig fleet. Longer laterals, higher proppant loading, and real-time frac optimization push recovery per well higher while trimming costs. ExxonMobil's integration of Pioneer aims for a further 15% uplift through standardized execution and shared infrastructure. Independent drillers mirror these tactics to remain competitive. Efficiency, therefore, anchors continued output gains that fortify the US oil and gas market against price swings
Surging LNG Export Capacity
New Gulf Coast liquefaction trains reshape demand by linking domestic supply to global price premia. Venture Global's Plaquemines terminal added 20 million tpa capacity in 2024, with Golden Pass to follow at 15.6 million tpa. The export surge boosts Appalachian and Haynesville drilling, while USD 15 billion of new pipelines funnel volumes south. Closer alignment with world markets tempers seasonal Henry Hub volatility, strengthening forward visibility for producers and midstream players, and reinforcing expansion in the US oil and gas market.
Methane-fee Compliance Costs Under EPA OOOOb/c
Beginning in 2024, methane emissions exceeding set thresholds incur fees starting at USD 900 per metric ton and rising to USD 1,500 by 2026. Added monitoring and repair programs raise operating costs by USD 2-4 per barrel for typical shale wells, hitting smaller producers hardest. Compliance demands speed consolidation and quick adoption of technology, such as continuous leak detection, to alter cost structures within the US oil and gas market.
Other drivers and restraints analyzed in the detailed report include:
- AI-driven Seismic Analytics for Marginal Well Recovery
- IRA 45Q & 45V Tax Credits Lowering CCS Costs
- Water-stress Limits on Permian Fracturing
For complete list of drivers and restraints, kindly check the Table Of Contents.
Segment Analysis
Upstream claimed 71.85% of the US oil and gas market size in 2025 and is on track for a 4.84% CAGR to 2031. Midstream captured 18.40%, buoyed by pipeline additions and LNG terminal build-outs, while downstream refining held 9.75% amid capacity limits and tighter emissions rules. Operators now target internal rates above 15% at USD 60 oil, steering capital toward high-return shale laterals and select long-cycle projects. ConocoPhillips' Willow development illustrates the shift, with 30-year reserves offering cash-flow depth rare in short-cycle shale projects. Drilling efficiency and disciplined reinvestment keep the upstream segment at the center of continued gains in the US oil and gas market.
Upstream's dominance rests on rapid productivity gains that hold costs near sub-USD 40 per barrel breakevens. Midstream remains an opportunity-rich sector as LNG growth drives storage and takeaway needs, yet capital discipline tempers speculative projects. Downstream margins are tightening amid competition from renewable diesel and the cost of regulatory upgrades. Together, these dynamics reinforce the upstream sector's outsized influence on revenue trends within the US oil and gas market.
Complete Report Scope:
- By Sector
- Upstream
- Midstream
- Downstream
- By Location
- Onshore
- Offshore
- By Service
- Construction
- Maintenance and Turn-around
- Decommissioning
List of Companies Covered in this Report:
- Exxon Mobil Corp.
- Chevron Corp.
- ConocoPhillips Co.
- EOG Resources Inc.
- Occidental Petroleum Corp.
- Pioneer Natural Resources Co.
- Phillips 66 Co.
- Valero Energy Corp.
- Marathon Petroleum Corp.
- Hess Corp.
- Devon Energy Corp.
- BP PLC
- Shell PLC
Additional Benefits:
- The market estimate (ME) sheet in Excel format
- 3 months of analyst support
TABLE OF CONTENTS
1 Introduction
- 1.1 Study Assumptions & Market Definition
- 1.2 Scope of the Study
2 Research Methodology
3 Executive Summary
4 Market Landscape
- 4.1 Market Overview
- 4.2 Market Drivers
- 4.2.1 Tight-oil productivity gains in the Permian
- 4.2.2 Surging LNG export capacity (new Gulf Coast trains)
- 4.2.3 AI-driven seismic analytics for marginal well recovery
- 4.2.4 IRA 45Q & 45V tax credits lowering CCS costs
- 4.2.5 Corporate green-bond funding for midstream build-out
- 4.2.6 Niche petro-feedstock demand from advanced plastics
- 4.3 Market Restraints
- 4.3.1 Methane-fee compliance costs under EPA OOOOb/c
- 4.3.2 Growing state-level setback rules (e.g., CO, NM)
- 4.3.3 Water-stress limits on Permian fracturing
- 4.3.4 Persistent WTI-Brent discount hurting exports
- 4.4 Supply-Chain Analysis
- 4.5 Regulatory Landscape
- 4.6 Technological Outlook
- 4.7 Crude-Oil Production & Consumption Outlook
- 4.8 Natural-Gas Production & Consumption Outlook
- 4.9 Installed Pipeline Capacity Analysis
- 4.10 Unconventional Resources CAPEX Outlook (tight oil, oil sands, deep-water)
- 4.11 Porter's Five Forces
- 4.11.1 Bargaining Power - Suppliers
- 4.11.2 Bargaining Power - Buyers
- 4.11.3 Threat of New Entrants
- 4.11.4 Threat of Substitutes
- 4.11.5 Competitive Rivalry
- 4.12 PESTLE Analysis
5 Market Size & Growth Forecasts
- 5.1 By Sector
- 5.1.1 Upstream
- 5.1.2 Midstream
- 5.1.3 Downstream
- 5.2 By Location
- 5.2.1 Onshore
- 5.2.2 Offshore
- 5.3 By Service
- 5.3.1 Construction
- 5.3.2 Maintenance and Turn-around
- 5.3.3 Decommissioning
6 Competitive Landscape
- 6.1 Market Concentration
- 6.2 Strategic Moves (M&A, Partnerships, PPAs)
- 6.3 Market Share Analysis (Market Rank/Share for key companies)
- 6.4 Company Profiles (includes Global level Overview, Market level overview, Core Segments, Financials as available, Strategic Information, Products & Services, and Recent Developments)
- 6.4.1 Exxon Mobil Corp.
- 6.4.2 Chevron Corp.
- 6.4.3 ConocoPhillips Co.
- 6.4.4 EOG Resources Inc.
- 6.4.5 Occidental Petroleum Corp.
- 6.4.6 Pioneer Natural Resources Co.
- 6.4.7 Phillips 66 Co.
- 6.4.8 Valero Energy Corp.
- 6.4.9 Marathon Petroleum Corp.
- 6.4.10 Hess Corp.
- 6.4.11 Devon Energy Corp.
- 6.4.12 BP PLC
- 6.4.13 Shell PLC
7 Market Opportunities & Future Outlook
- 7.1 White-space & Unmet-need Assessment