
|
시장보고서
상품코드
2125673
아시아태평양의 데이터센터 건설 시장 : 시장 점유율 분석, 업계 동향 및 통계, 성장 예측(2026-2031년)APAC Data Center Construction - Market Share Analysis, Industry Trends & Statistics, Growth Forecasts (2026 - 2031) |
||||||
 Mordor Intelligence
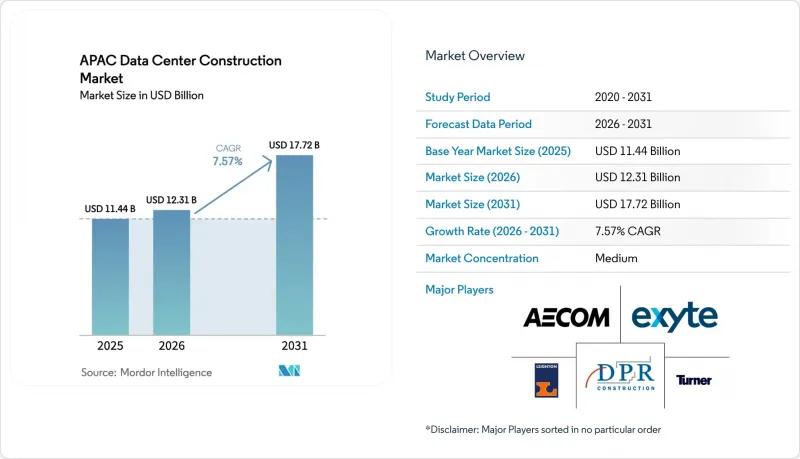
아시아태평양의 데이터센터 건설 시장 규모는 2026년에 123억 1,000만 달러로 추정되고, 2025년 114억 4,000만 달러에서 성장하여 2031년에는 177억 2,000만 달러에 이를 것으로 예측됩니다.
2026-2031년 연평균 성장률(CAGR) 7.57%로 성장할 것으로 전망됩니다.
본 보고서에서는 업계를 인프라별(전기 인프라, 기계 인프라, 일반 건설), 티어 유형별(Tier 1 및 2, Tier 3, Tier 4), 데이터센터 유형별(코로케이션, 하이퍼스케일러(CSP)에 의한 자체 건설 등)로 세분화하고 있습니다. 시장 규모 및 전망은 상기 모든 부문에 대해 금액(백만 달러) 단위로 제시되어 있습니다.
아시아태평양의 데이터센터 건설 시장 동향 및 인사이트
하이퍼스케일 및 AI에 따른 고밀도 캠퍼스 수요
아시아태평양의 사업자들은 생성형 AI 모델의 대규모 훈련을 수행하기 위해, 기존 기준의 3배에 해당하는 40-80kW 랙을 수용할 수 있도록 레이아웃 재설계를 추진하고 있습니다. 한국 및 일본의 캠퍼스 설계도에는 이미 수 기가와트 규모의 유틸리티 전력 공급과 칩 직결형 액체 냉각이 규정되어 있습니다. 각 하이퍼스케일러 기업들은 지연 시간 및 보안 측면에서 전력, 네트워크, 열 환경 관리가 필수적이라고 판단하고 있으며, 이에 따라 설계·건설 기업들은 도입 기간을 대폭 단축할 수 있는 모듈식 조립형 전기실 도입을 추진하고 있습니다. 자본 흐름도 이러한 변화를 반영하고 있으며, SK텔레콤은 2028년까지 AI 인프라에 3조 4,000억 원을 배정하고 있습니다. 장비 벤더들은 GPU에 최적화된 개폐 장치와 수냉식 서버 섀시로 이에 대응하고 있으며, 반도체 공급업체와 건설 시공사 간의 협력 관계가 더욱 긴밀해지고 있습니다.
정부의 디지털 경제 및 5G 추진
중국의 ‘동부 데이터·서부 컴퓨팅’ 프로그램이나 일본의 반도체·디지털 산업 로드맵과 같은 정책을 통해 국가의 컴퓨팅 역량에 연동된 명확한 구축 목표가 설정되어 있습니다. 베이징의 이니셔티브만 해도 2030년까지 8개의 국가 허브와 10개의 지역 클러스터를 구축하기 위해 4,000억-5,000억 위안이 동원되고 있습니다. 베트남에서도 유사한 법률에 따라 2025년 7월부터 위험 평가 기능을 통합한 ‘국가 데이터센터’의 설치가 의무화되었으며, 이는 곧바로 입찰 활동으로 이어지고 있습니다. 이와 병행하여 전국적으로 진행되고 있는 5G 구축으로 인해 엣지 노드에 대한 요구 사항이 높아지고 있으며, 통신 사업자들은 사용자 플레인의 지연을 줄이기 위해 통신 타워 인프라와 함께 마이크로 시설을 임대하거나 공동 개발하고 있습니다.
데이터 주권 관련 규정 준수 장애물
중국과 베트남의 새로운 국경 간 데이터 전송 규정에 따라 사업자는 위험 평가를 실시하고 데이터 보안 책임자를 임명해야 할 의무가 있어, 법적 및 기술적 부담이 증가하고 있습니다. ‘중요 데이터’에 대한 통일된 정의가 존재하지 않기 때문에 다국적 클라우드 플랫폼은 국가별로 인프라를 중복 구축할 수밖에 없습니다. 기업들은 중복되는 아카이브 시스템으로 인해 15-20%의 추가 운영 비용을 부담하고 있으며, 건설 단계의 설계에서는 각국 고유의 케이지 분리 규정을 준수하기 위해 여분의 공간을 확보해야 합니다.
부문 분석
2025년, 아시아태평양 데이터센터 건설 시장에서 Tier 3 사이트가 70.45%를 차지했으며, 대부분의 기업 및 클라우드 이용 사례에서 그 비용 효율성이 입증되었습니다. 그러나 하이퍼스케일 AI 훈련에는 오류 방지용 중복성이 요구되므로, Tier 4 용량은 2031년까지 연평균 성장률(CAGR) 10.67%를 기록할 전망입니다. 아시아태평양 데이터센터 건설 시장에서 Tier 4 시설 시장 규모가 가장 빠르게 확대되고 있는 곳은 한국과 일본입니다. 이들 국가에서는 멀티 페타플롭급 클러스터가 도입되어 있어 병렬 유지보수가 필수적입니다. 사업자들은 계약 조항에 따라 99.995%의 가동률이 보장되므로, 추정 40-60%의 설비 투자(CAPEX) 프리미엄을 수용하고 있습니다. 이는 GPU 임대를 통한 수익원을 확보하기 위한 전제조건이 되고 있습니다. 업타임 인스티튜트의 인증은 경쟁상의 차별화 요인으로 자리 잡고 있습니다. NEXTDC 인증을 받은 시드니의 Tier IV 캠퍼스는 감사에 기반한 인증이 어떻게 프리미엄 가격 확보로 이어지는지를 보여주고 있습니다. 동시에 중국과 호주의 일부 계약에서는 별도의 변전소에서 공급되는 이중 전력 공급 등 ‘Tier 4 플러스’의 추가 요건이 명시되어 있습니다. 엣지 및 산업용 IoT 노드를 위한 Tier 1 및 Tier 2 시설이 여전히 존재하지만, 기업의 코로케이션 계약 갱신이 더 높은 내결함성을 갖춘 티어로 전환됨에 따라 그 중요성은 감소하고 있습니다.
2025년에도 코로케이션은 아시아태평양 데이터센터 건설 시장 점유율의 54.62%를 차지했으며, 캐리어 중립적인 상호 연결을 요구하는 금융 서비스 및 게임 업계의 테넌트에 의해 뒷받침되고 있습니다. 그럼에도 불구하고, 아마존, 구글, 마이크로소프트, 알리바바의 자체 구축 추세로 인해 2031년까지 소유주 운영형 캠퍼스의 연평균 성장률(CAGR)은 12.05%를 나타낼 것으로 전망됩니다. 아시아태평양 데이터센터 건설 시장에서 자체 건설 프로젝트의 규모는 호주에서 급속히 확대되고 있으며, 호주에서는 AWS만 해도 2025-2029년 신규 용량 확충에 200억 호주 달러를 투입할 예정입니다.
각 하이퍼스케일러 기업들이 부동산을 자체 보유하는 가운데, 코로케이션 기존 사업자들은 서비스가 미흡한 대도시권에 집적하여 관리형 AI 플랫폼 서비스를 다층적으로 제공함으로써 대응하고 있습니다. ST 텔레미디어 세계 데이터센터스는 인도에서 550MW 규모의 건설에 32억 달러를 투자하여, 홀 시설을 턴키 방식의 GPU 포드로 재구성할 예정입니다. 엣지 및 엔터프라이즈용 마이크로 사이트도 성장하고 있지만, 그 속도는 완만하며 5G의 고도화와 기업의 하이브리드 클라우드 선호 경향에 따라 좌우되고 있습니다.
기타 혜택 :
- 엑셀 형식 시장 예측(ME) 시트
- 3개월간의 애널리스트 지원
자주 묻는 질문
목차
제1장 서론
제2장 조사 방법
제3장 주요 요약
제4장 시장 구도
제5장 데이터센터 주요 통계
제6장 아시아태평양의 데이터센터 건설에 대한 인공지능(AI) 도입
제7장 규제 및 컴플라이언스 프레임워크
제8장 시장 규모 및 성장 예측
제9장 경쟁 구도
제10장 시장 기회 및 향후 전망
AJYAccording to Mordor Intelligence, the Asia Pacific data center construction market size in 2026 is estimated at USD 12.31 billion, growing from 2025 value of USD 11.44 billion with 2031 projections showing USD 17.72 billion, growing at 7.57% CAGR over 2026-2031.
This report Segments the Industry Into Infrastructure (By Electrical Infrastructure, by Mechanical Infrastructure, General Construction), by Tier Type (Tier 1 and 2, Tier 3, Tier 4), by Data Center Type (Colocation, Self-Built Hyperscalers (CSPs) and More). The Market Sizes and Forecasts are Provided in Terms of Value (USD Million) for all the Above Segments.
APAC Data Center Construction Market Trends and Insights
Hyperscale and AI demand for high-density campuses
Asia Pacific operators are re-engineering layouts to host 40-80 kW racks, triple traditional thresholds, in order to run generative-AI model training at scale. South Korean and Japanese campus blueprints already stipulate multi-gigawatt utility feeds and direct-to-chip liquid cooling. Hyperscalers view control of power, network, and thermal environments as non-negotiable for latency and security, pushing design-build firms toward modular, prefabricated electrical rooms that slash deployment timelines. Capital flows mirror this shift; SK Telecom has earmarked KRW 3.4 trillion for AI infrastructure through 2028. Equipment vendors are responding with GPU-optimized switchgear and immersion-ready server chassis, tightening collaboration between silicon suppliers and construction contractors.
Government digital-economy and 5G push
Mandates such as China's Eastern Data Western Compute program and Japan's semiconductor and digital-industry roadmap are creating explicit build targets tied to sovereign compute capacity. Beijing's initiative alone is mobilizing 400-500 billion RMB to deploy eight national hubs and ten regional clusters by 2030. Similar laws in Vietnam require a National Data Centre with integrated risk-assessment functions beginning July 2025, immediately translating into tender activity. Parallel nationwide 5G rollouts elevate edge-node requirements, with telecom carriers leasing or co-developing micro-facilities alongside tower infrastructure to lower user-plane latency.
Data-sovereignty compliance hurdles
New cross-border transfer rules in China and Vietnam obligate operators to perform risk assessments and appoint data-security officers, increasing both legal and technical overhead. The absence of a unified definition for "important data" forces multinational cloud platforms to replicate infrastructure country by country. Enterprises are incurring 15-20% incremental operating expense for duplicate archival systems, while construction-stage design must allocate extra white-space for nation-specific cage segregation.
Other drivers and restraints analyzed in the detailed report include:
- Sustainability-linked green financing
- Edge DC builds at new submarine-cable landings
- Power-grid bottlenecks in tier-1 metros
For complete list of drivers and restraints, kindly check the Table Of Contents.
Segment Analysis
Tier 3 sites accounted for 70.45% of the Asia Pacific data center construction market in 2025, validating their cost-efficiency for most enterprise and cloud use cases. Yet hyperscale AI training demands fail-safe redundancy; therefore Tier 4 capacity is set to register an 10.67% CAGR through 2031. The Asia Pacific data center construction market size for Tier 4 builds is rising fastest in South Korea and Japan where multi-petaflop clusters mandate concurrent maintainability. Operators accept an estimated 40-60% capex premium because contract clauses guarantee 99.995% uptime, a pre-condition for GPU leasing revenue streams. Uptime Institute certifications are becoming competitive differentiators. NEXTDC's accredited Tier IV Sydney campus illustrates how audit-based credentials secure premium pricing. Simultaneously, some Chinese and Australian contracts specify "Tier 4-plus" add-ons such as dual utility feeds from separate substations. Although Tier 1 and Tier 2 footprints persist for edge or industrial IoT nodes, their relevance is shrinking as enterprise colocation renewals migrate to higher resilience tiers.
Colocation still held 54.62% of the Asia Pacific data center construction market share in 2025, buoyed by financial-services and gaming tenants seeking carrier-neutral interconnect. Nevertheless, the self-build trajectory of Amazon, Google, Microsoft, and Alibaba underpins a 12.05% CAGR for owner-operated campuses to 2031. The Asia Pacific data center construction market size for self-build projects has escalated in Australia where AWS alone earmarked AUD 20 billion for new capacity between 2025 and 2029.
As hyperscalers internalize real estate, colocation incumbents respond by clustering in under-served metros and layering managed AI-platform services. ST Telemedia Global Data Centres will inject USD 3.2 billion into 550 MW of India builds, repackaging halls as turnkey GPU-pods. Edge and enterprise micro-sites also grow but at a measured clip, hinging on 5G densification and corporate hybrid-cloud preferences.
Complete Report Scope:
- By Tier Type
- Tier 1 and 2
- Tier 3
- Tier 4
- By Data Center Type
- Colocation
- Self-build Hyperscalers (CSPs)
- Enterprise and Edge
- By Infrastructure
- By Electrical Infrastructure
- Power Distribution Solution
- Power Backup Solutions
- By Mechanical Infrastructure
- Cooling Systems
- Racks and Cabinets
- Servers and Storage
- Other Mechanical Infrastructure
- General Construction
- Service - Design and Consulting, Integration, Support and Maintenance
- By Electrical Infrastructure
List of Companies Covered in this Report:
- AECOM
- DPR Construction Inc.
- Fortis Construction Inc.
- Goodman Group
- Hibiya Engineering Ltd.
- Larsen and Toubro Limited
- GIC Private Limited
- Sino Group
- Citramas Group
- Aurecon Group Pty Ltd
- Turner Construction Company
- Jacobs Solutions Inc.
- Exyte GmbH
- Leighton Asia (CIMIC Group)
- Gamuda Berhad
- YTL Power International Berhad
- China Communications Services Corp. Ltd.
- ST Telemedia Global Data Centres
- Chindata Group Holdings Ltd.
- ST Engineering - Digital Systems
Additional Benefits:
- The market estimate (ME) sheet in Excel format
- 3 months of analyst support
TABLE OF CONTENTS
1 INTRODUCTION
- 1.1 Study Assumptions and Market Definition
- 1.2 Scope of the Study
2 RESEARCH METHODOLOGY
3 EXECUTIVE SUMMARY
4 MARKET LANDSCAPE
- 4.1 Market Overview
- 4.2 Market Drivers
- 4.2.1 Hyperscale and AI demand for high-density campuses
- 4.2.2 Government digital-economy and 5G push
- 4.2.3 Sustainability-linked green financing
- 4.2.4 Spill-over migration from Singapore to Johor and Batam
- 4.2.5 Edge DC builds at new submarine-cable landings
- 4.2.6 Inland-China provincial land-power incentives
- 4.3 Market Restraints
- 4.3.1 Data-sovereignty compliance hurdles
- 4.3.2 Power-grid bottlenecks in tier-1 metros
- 4.3.3 High-seismic-zone insurance premiums
- 4.3.4 Liquid-cooling talent gap
- 4.4 Value / Supply-Chain Analysis
- 4.5 Regulatory Landscape
- 4.6 Technological Outlook
- 4.7 Porter's Five Forces
- 4.7.1 Bargaining Power of Suppliers
- 4.7.2 Bargaining Power of Consumers
- 4.7.3 Threat of New Entrants
- 4.7.4 Threat of Substitutes
- 4.7.5 Intensity of Competitive Rivalry
5 KEY DATA CENTER STATISTICS
- 5.1 Exhaustive Data Center Operators in Asia-Pacific (in MW)
- 5.2 List of Major Upcoming Data Center Projects in Asia-Pacific (2025-2030)
- 5.3 CAPEX and OPEX For Asia-Pacific Data Center Construction
- 5.4 Data Center Power Capacity Absorption In MW, Selected Cities, Asia-Pacific, 2023 and 2024
6 ARTIFICIAL INTELLIGENCE (AI) INCLUSION IN DATA CENTER CONSTRUCTION IN Asia-Pacific
7 REGULATORY and COMPLIANCE FRAMEWORK
8 MARKET SIZE and GROWTH FORECASTS (VALUE)
- 8.1 By Tier Type
- 8.1.1 Tier 1 and 2
- 8.1.2 Tier 3
- 8.1.3 Tier 4
- 8.2 By Data Center Type
- 8.2.1 Colocation
- 8.2.2 Self-build Hyperscalers (CSPs)
- 8.2.3 Enterprise and Edge
- 8.3 By Infrastructure
- 8.3.1 By Electrical Infrastructure
- 8.3.1.1 Power Distribution Solution
- 8.3.1.2 Power Backup Solutions
- 8.3.2 By Mechanical Infrastructure
- 8.3.2.1 Cooling Systems
- 8.3.2.2 Racks and Cabinets
- 8.3.2.3 Servers and Storage
- 8.3.2.4 Other Mechanical Infrastructure
- 8.3.3 General Construction
- 8.3.4 Service - Design and Consulting, Integration, Support and Maintenance
- 8.3.1 By Electrical Infrastructure
9 COMPETITIVE LANDSCAPE
- 9.1 Market Concentration
- 9.2 Strategic Moves
- 9.3 Market Share Analysis
- 9.4 Data Center Infrastructure Investment Based on Megawatt (MW) Capacity, 2024 vs 2030
- 9.5 Data Center Construction Landscape (Key Vendors Listings)
- 9.6 Company Profiles (includes Global level Overview, Market level overview, Core Segments, Financials as available, Strategic Information, Market Rank/Share for key companies, Products and Services, Recent Developments)
- 9.6.1 AECOM
- 9.6.2 DPR Construction Inc.
- 9.6.3 Fortis Construction Inc.
- 9.6.4 Goodman Group
- 9.6.5 Hibiya Engineering Ltd.
- 9.6.6 Larsen and Toubro Limited
- 9.6.7 GIC Private Limited
- 9.6.8 Sino Group
- 9.6.9 Citramas Group
- 9.6.10 Aurecon Group Pty Ltd
- 9.6.11 Turner Construction Company
- 9.6.12 Jacobs Solutions Inc.
- 9.6.13 Exyte GmbH
- 9.6.14 Leighton Asia (CIMIC Group)
- 9.6.15 Gamuda Berhad
- 9.6.16 YTL Power International Berhad
- 9.6.17 China Communications Services Corp. Ltd.
- 9.6.18 ST Telemedia Global Data Centres
- 9.6.19 Chindata Group Holdings Ltd.
- 9.6.20 ST Engineering - Digital Systems
10 MARKET OPPORTUNITIES and FUTURE OUTLOOK
- 10.1 White-Space and Unmet-Need Assessment